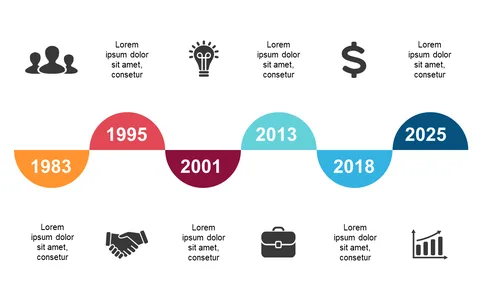
Engage Audiences with Colorful Timeline Infographic
Product Description
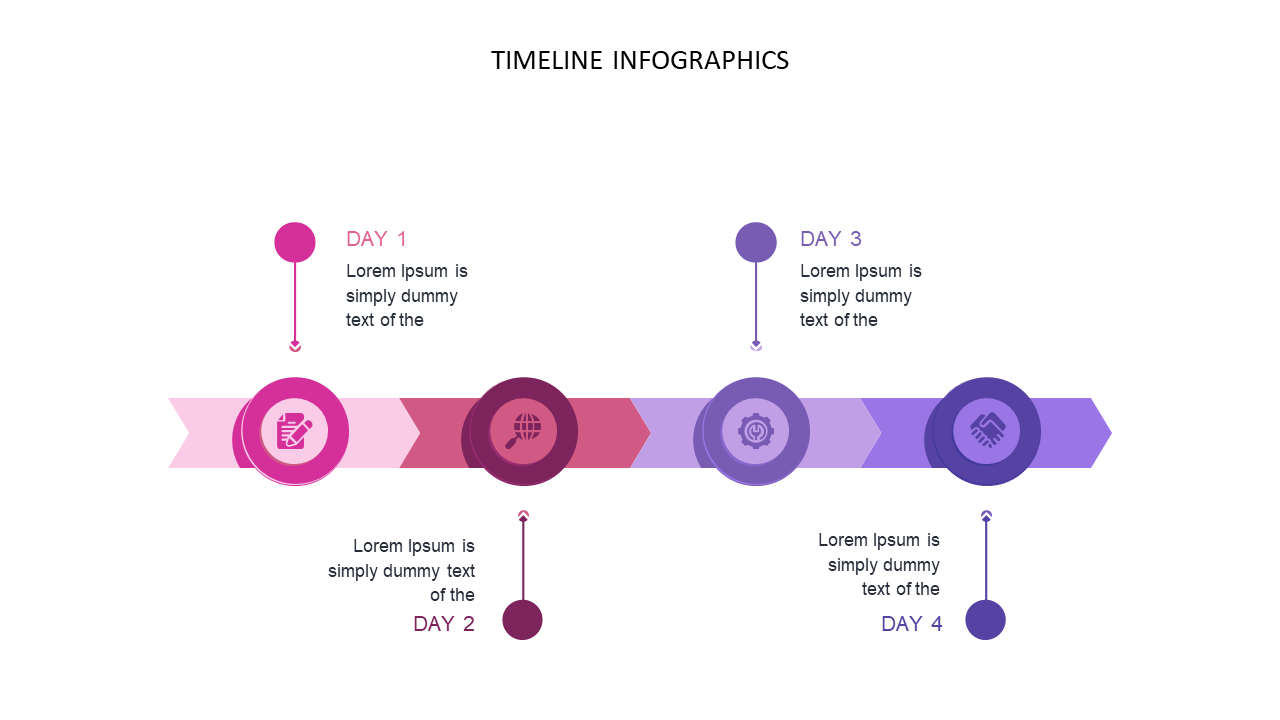
Keeping everyone aligned on project phases can be a real headache, especially when timelines and deadlines start to blur. This colorful timeline infographic transforms complex project milestones into a visually appealing format that grabs attention and clarifies key deliverables.
It’s designed to help you communicate your project’s journey clearly, ensuring no important dates slip through the cracks. Project managers and team leads in industries like IT, marketing, or event planning can benefit immensely from this slide. Whether you’re updating your team during a status meeting or pitching a project to executives, this infographic helps you convey your message effectively and keeps everyone on the same page.
At just $0.99, this slide is an instant download that’s fully editable in PowerPoint and Google Slides. You’ll be able to customize it to fit your specific project needs and have it ready for your next presentation in no time.
$0.99 – Purchase Checkout
Added to cart