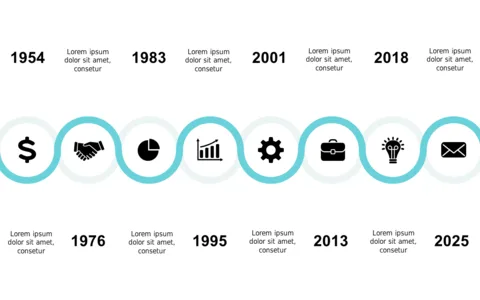
Engaging Colorful Timeline for Business Progress

Product Description
Keeping your team informed about progress can feel overwhelming, especially when timelines are intricate and detailed. This engaging colorful timeline makes it simple to present your business’s achievements over the years, providing a clear and attractive way to illustrate progress.
Ideal for marketing directors or business development managers, this slide works well in company-wide presentations or strategy sessions where you need to showcase growth and milestones. It’s also useful for product teams reporting on their development journey during stakeholder meetings.
At just $0.99, you can download this visually captivating slide, which can easily be customized in PowerPoint or Google Slides. Spend less time on design and more time delivering your message clearly.
$0.99 – Purchase Checkout
Added to cart