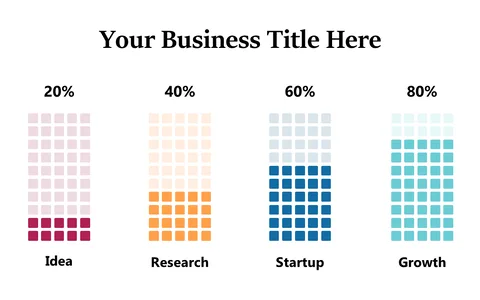
Illustrate Growth Trajectories with Step Chart
Product Description
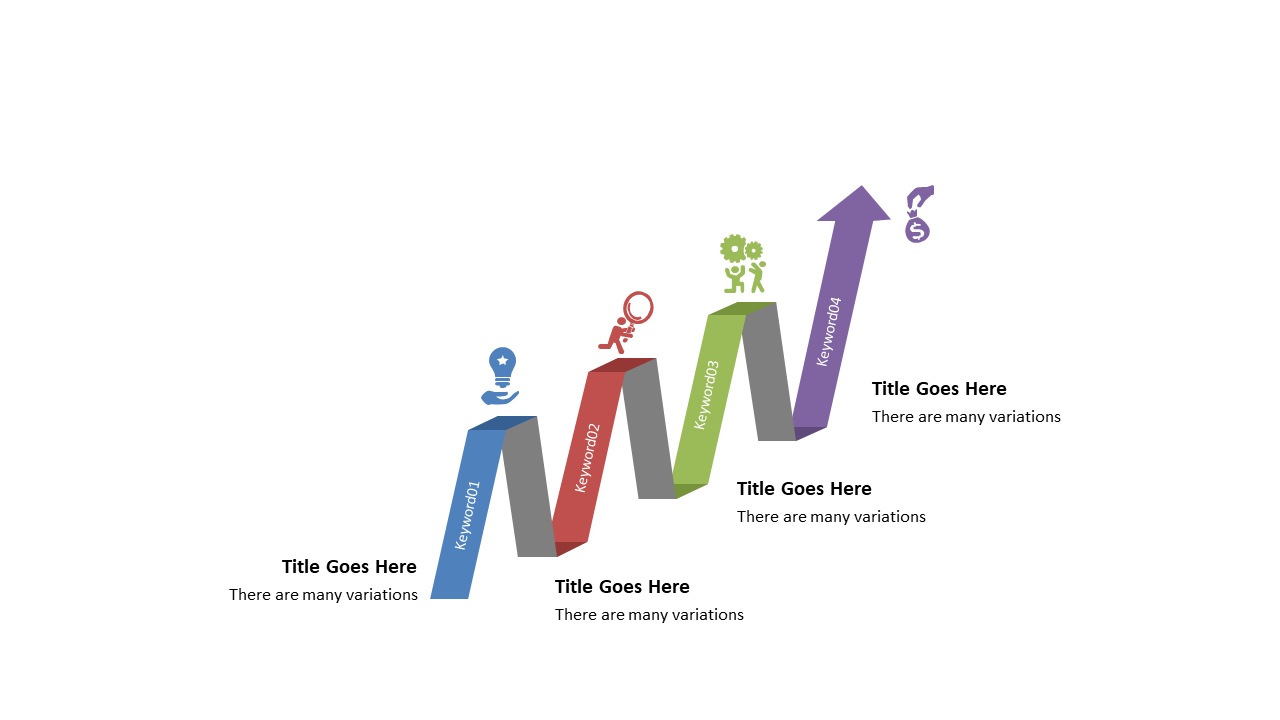
Conveying growth trajectories effectively can be a daunting task, especially when you need to illustrate various stages clearly. This step chart slide provides a visually appealing way to lay out your progress, helping your audience grasp the key milestones at a glance.
Use this in your next quarterly business review as a marketing manager or when presenting growth strategies in a startup meeting as a business development professional. It’s also suitable for financial analysts showcasing projections or performance metrics.
At just $0.99, you can download this slide and have it ready for editing in PowerPoint or Google Slides within minutes. Customize it easily to fit your needs and make your growth story shine.
$0.99 – Purchase Checkout
Added to cart