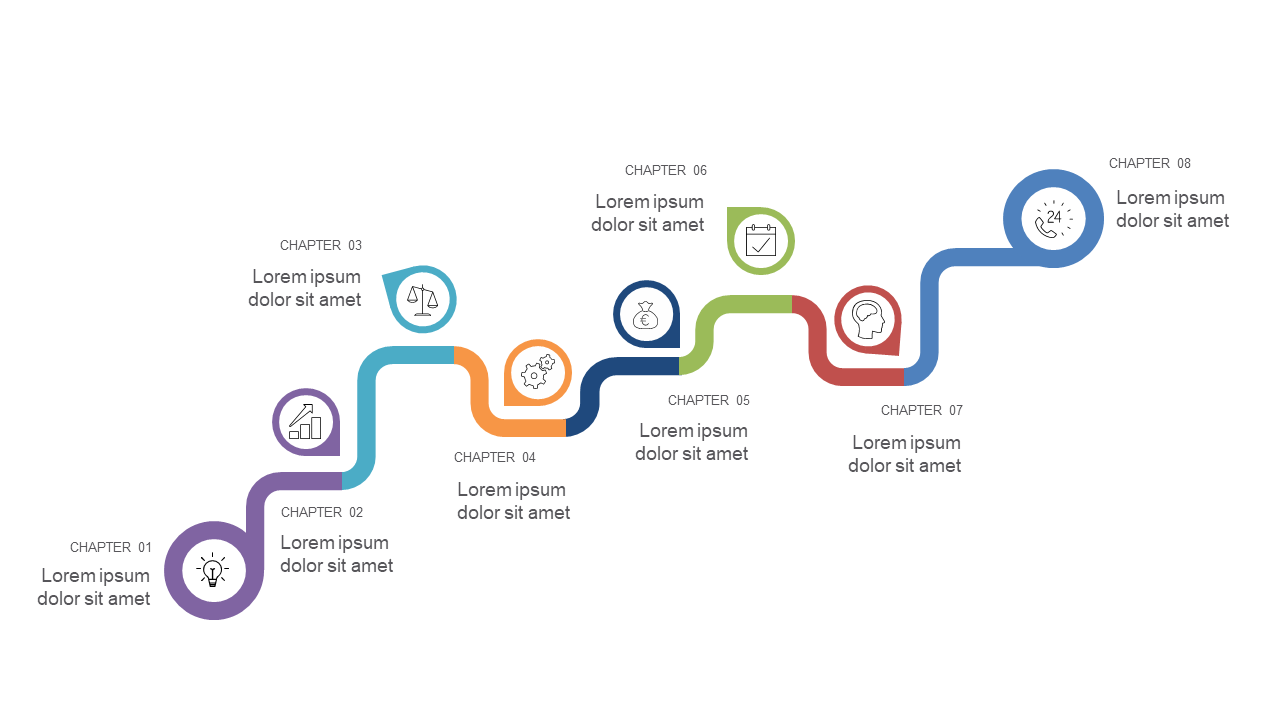
Illustrate Chapter Progression with Colorful Steps
Product Description
Conveying the stages of your project can often feel overwhelming, especially when you want to maintain clarity and engagement. You need a way to break down complex phases into digestible pieces that capture attention and guide your audience through the progression. This slide makes that possible with its colorful steps and icons, transforming your project timeline into something visually appealing.
This slide is perfect for project managers presenting updates during team meetings or product launches. Marketing professionals can also use it to illustrate campaign phases, while educators might find it useful when discussing curriculum development. No matter your industry, if you’re sharing the steps of any initiative, this slide is a great fit.
For just $0.99, you’ll receive an instant download that’s easily editable in PowerPoint and Google Slides. Within minutes,
you can customize the text and colors to make it uniquely yours and ready for your next presentation.
$0.99 – Purchase Checkout
Added to cart