Visualize Retail Data with Shopping Bag Chart V3
Product Description
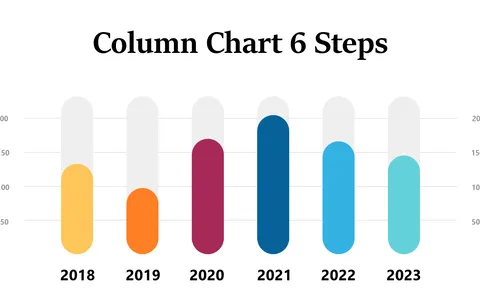
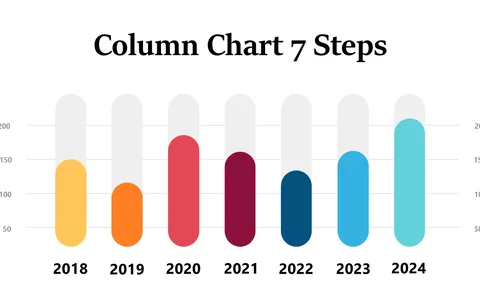
Under pressure to deliver compelling retail data, many professionals turn to uninspired visuals that fail to engage their audience. You need an eye-catching way to represent comparisons that keeps your viewers focused and informed.
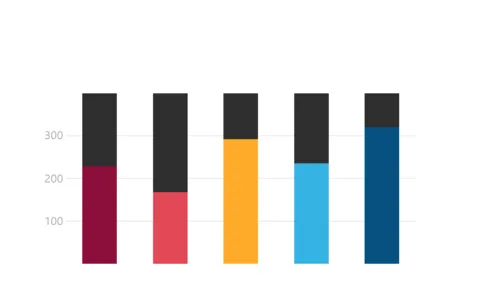
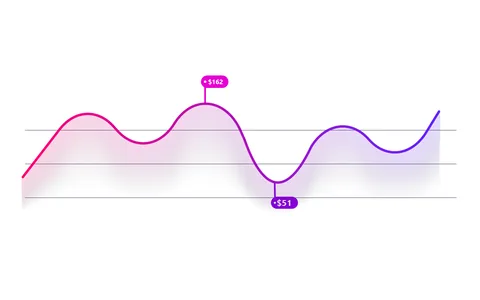
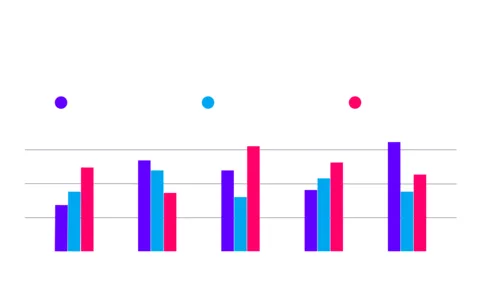
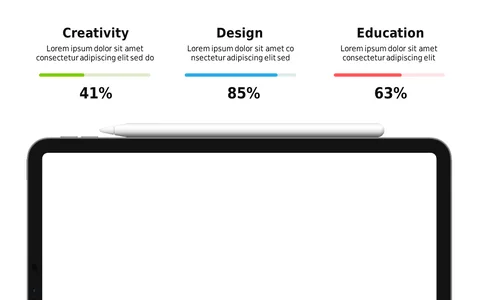
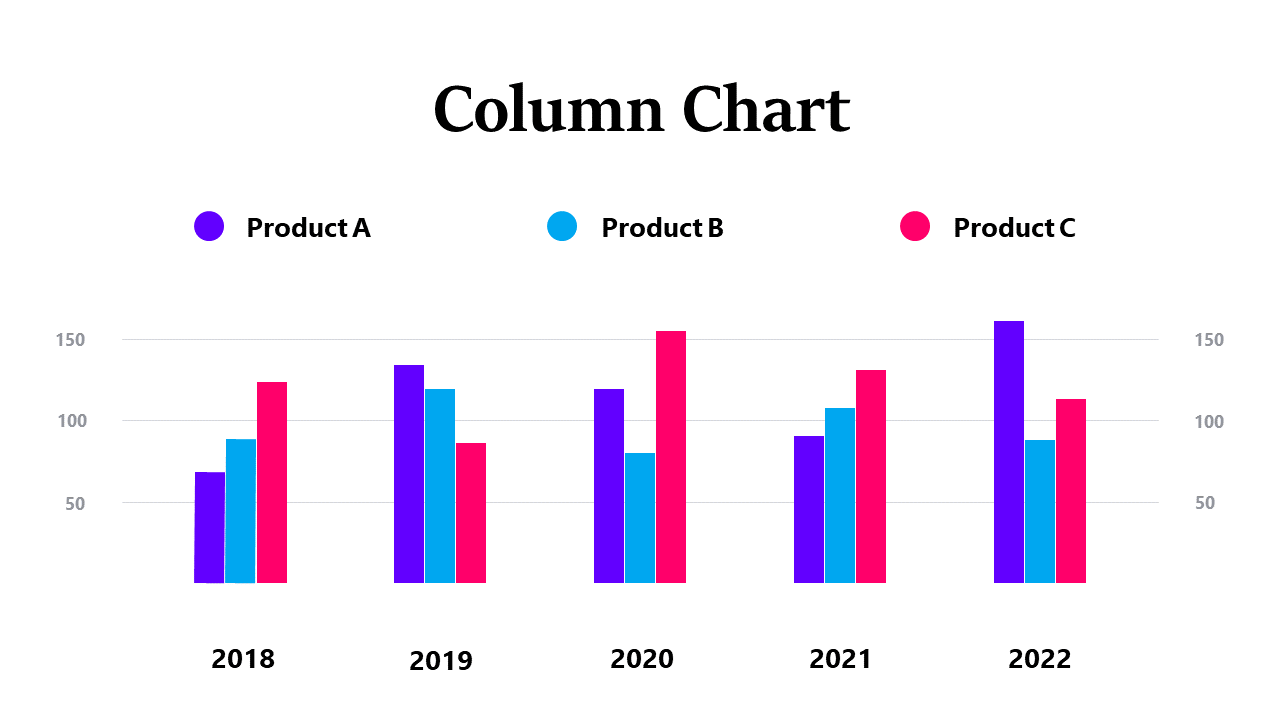
This vibrant shopping bag chart offers an ideal solution, turning complex information into a visually appealing display. Retail analysts, marketing professionals, and business development teams can leverage this slide during product launch meetings, sales strategy sessions, or performance reviews. The lively colors and clear design make it easier for your audience to quickly grasp and retain critical insights.
Available for just $0.99, this slide is ready for instant download and can be easily customized in PowerPoint or Google Slides. You’ll have a visually engaging tool to present your data effectively, all set up in minutes.
$0.99 – Purchase Checkout
Added to cart