Highlight Retail Metrics with Shopping Bag Chart V2
Product Description
Presenting retail metrics can often feel like navigating a maze of numbers, leaving your audience struggling to catch the essential insights. It’s crucial to use visuals that not only display data but also make comparisons clear.
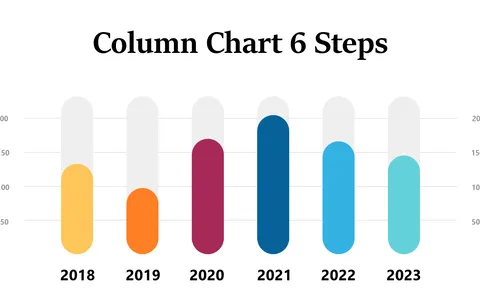
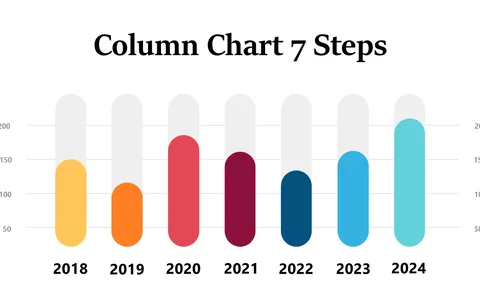
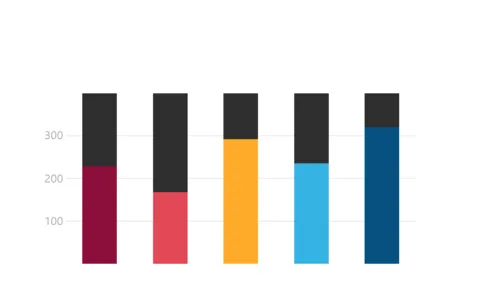
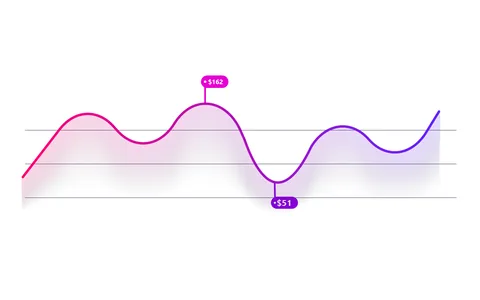
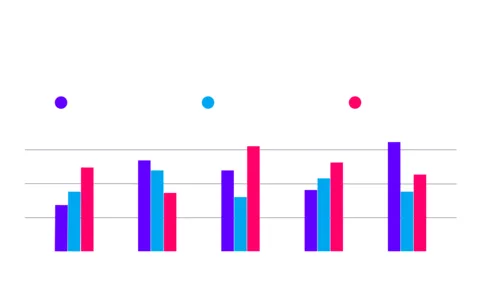
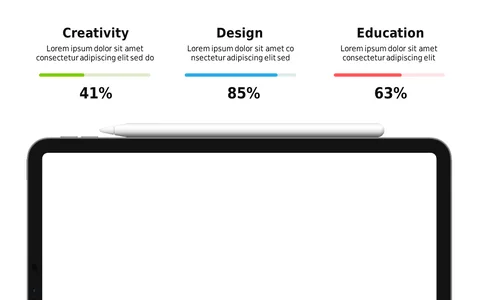
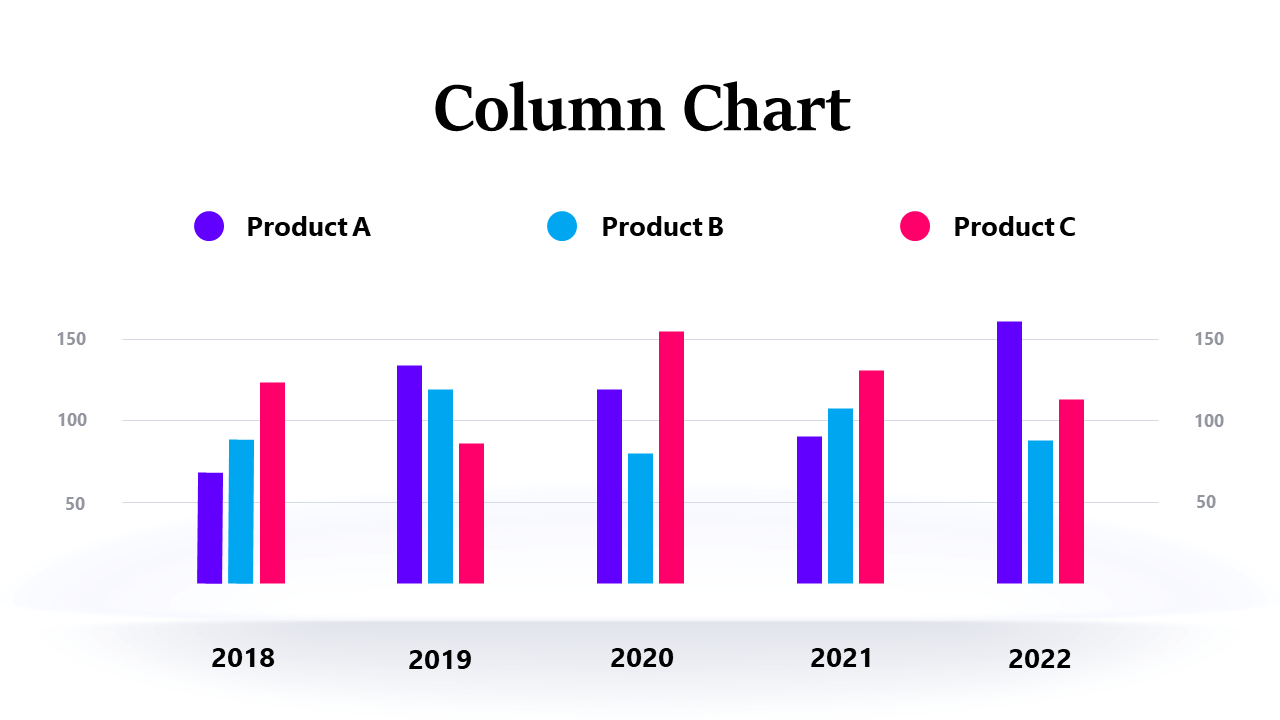
This shopping bag chart provides a colorful, intuitive way to present your retail metrics, simplifying the data for your audience. Business analysts, retail managers, and eCommerce specialists will find this slide highly beneficial during sales reviews, inventory assessments, or marketing strategy meetings. With this chart, you can depict sales figures, product performance, or customer engagement metrics in a format that makes it easy for everyone to understand key comparisons at a glance.
For just $0.99, this slide can be downloaded instantly and is fully editable, whether you’re using PowerPoint or Google Slides. You can quickly adjust the content to fit your needs and have a professional-looking presentation in no time.
$0.99 – Purchase Checkout
Added to cart