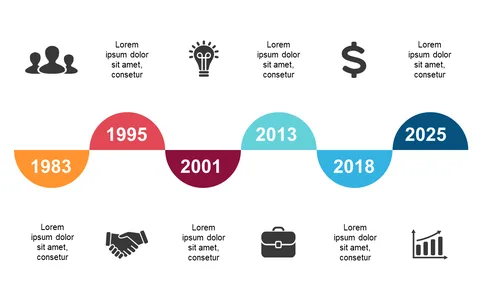
Highlight Key Achievements with Colorful Milestones

Product Description
Illustrating progress and key milestones can often feel daunting, especially when you want to keep your audience engaged. This vibrant timeline slide features colorful milestone markers and icons, making it easy to showcase achievements in a visually appealing way.
Ideal for program managers reporting on project status, team leaders summarizing annual accomplishments, or anyone needing to share growth over time, this slide can elevate your meetings. Picture it in a quarterly review or project kickoff, where clear visual progress is essential.
Available for just $0.99, you can instantly download this slide and edit it in PowerPoint or Google Slides. It’s designed for quick modifications, so you can focus on delivering your message effectively.
$0.99 – Purchase Checkout
Added to cart