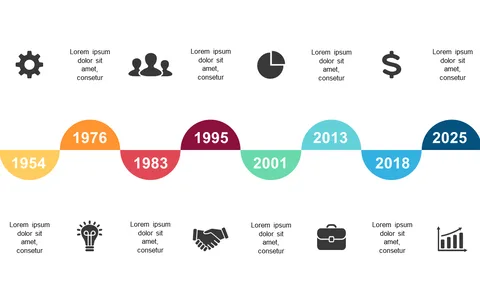
Present Historical Data with Milestone Icons
Product Description
When dealing with complex historical data, clearly communicating milestones can be a daunting task. You want your audience to grasp the key events without getting lost in the details, and a well-structured timeline can really help.
This slide provides a colorful series of milestone icons aligned along an engaging timeline, making data easy to follow and understand. Analysts, researchers, and educators can utilize this slide during presentations or reports to highlight significant historical events or project developments. Whether you’re briefing your team or presenting to a larger audience, this visually appealing format ensures clarity and keeps your listeners engaged.
At just $0.99, this slide is easy to download and can be edited swiftly in PowerPoint or Google Slides. You’ll be able to present your data with confidence and clarity, having a polished visual ready in just minutes.
$0.99 – Purchase Checkout
Added to cart