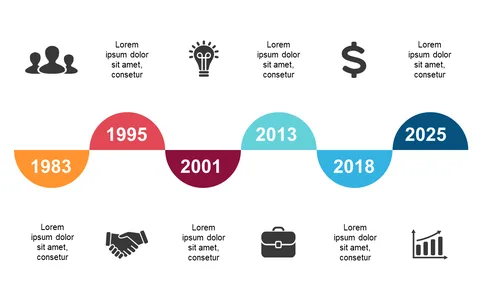
Engage Audience with Colorful Milestone Infographic Timeline

Product Description
Engaging your audience often requires more than just words; visuals can enhance your message tremendously. If you struggle with illustrating complex timelines, this colorful milestone infographic is the perfect solution.
It vividly showcases your significant achievements, making it easier for your audience to grasp the timeline of events. This slide is perfect for marketing directors highlighting campaign successes or project coordinators detailing progress during team briefings. It provides a dynamic way to share timelines during client presentations or investor meetings, where you need to capture attention and convey your story effectively.
Available for just $0.99, this slide is ready for instant download and can be quickly edited in PowerPoint and Google Slides. Elevate your presentations in minutes and captivate your audience with clarity!
$0.99 – Purchase Checkout
Added to cart