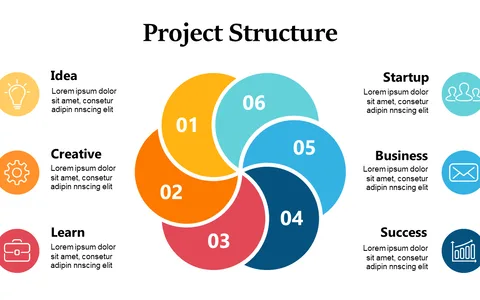
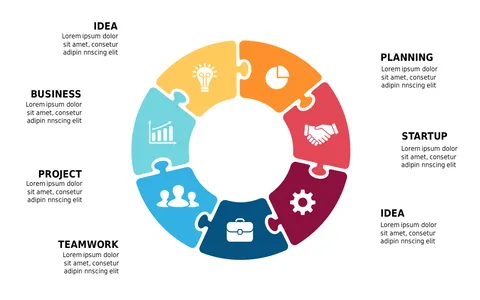
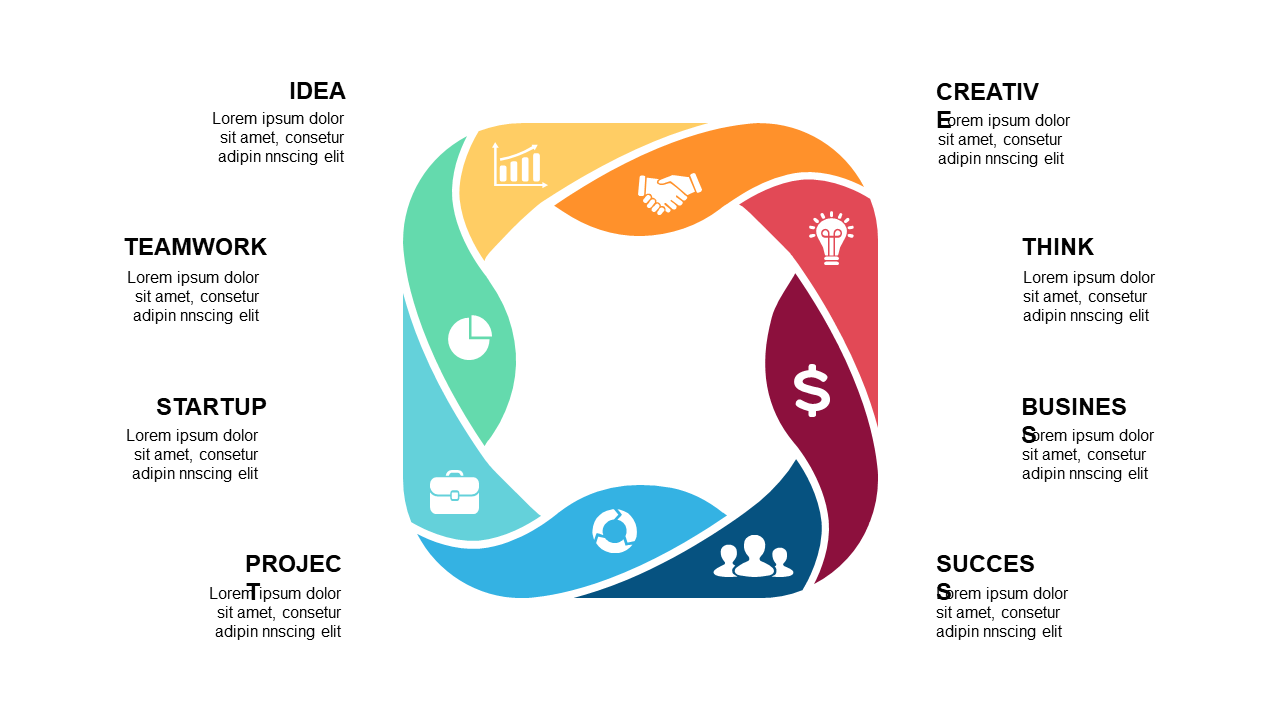
Engage Teams with a Colorful Cycle Diagram
Product Description
Maintaining your team’s attention during meetings can be a significant challenge in today’s fast-paced workplaces. A well-crafted visual can be the key to keeping everyone engaged and ensuring your message is understood.
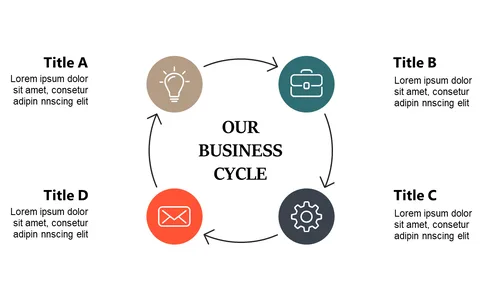
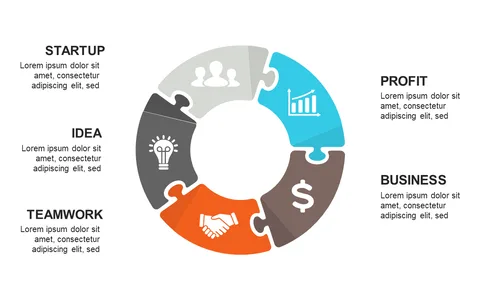
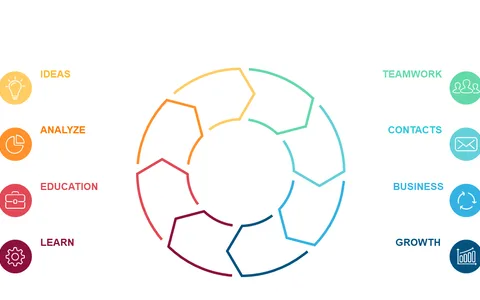
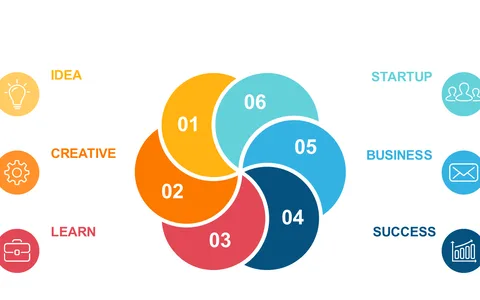
This colorful cycle diagram is designed to stand out with its vibrant hues and clear icons, making even complicated ideas easy to grasp. Team leaders, facilitators, and training specialists will find this slide invaluable for brainstorming sessions, strategy workshops, or team updates. Use it to illustrate team goals, project phases, or key performance indicators in a visually stimulating manner.
Available for just $0.99, this slide is ready for instant download and can be customized quickly in PowerPoint or Google Slides. Elevate your presentations instantly with this dynamic visual aid.
$0.99 – Purchase Checkout
Added to cart