Illustrate Business Milestones with a Circular Timeline

Product Description
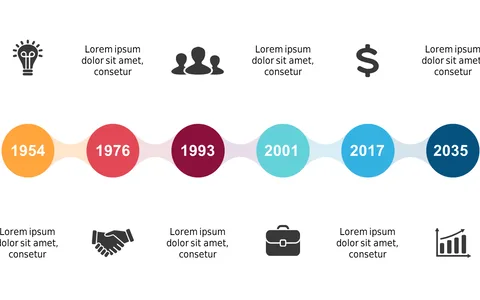
Managing projects can become overwhelming when it comes to tracking progress against milestones. Without a clear visualization, it’s easy for your audience to miss the significance of each step along the way. This circular timeline helps convey your project’s timeline in a straightforward manner that everyone can grasp.
Project managers, team leaders, and product developers in industries ranging from tech to marketing can find this slide invaluable during quarterly reviews and project kick-off meetings. It’s perfect for illustrating the journey from conception to realization and demonstrating how each milestone contributes to the overall project goals.
Download this slide for just $0.99 and get an instant, editable file that
you can easily customize in PowerPoint or Google Slides. It’s designed to save you time and keep your presentations engaging in just a few minutes.
$0.99 – Purchase Checkout
Added to cart