Illustrate Project Lifecycle with Circular Timeline

Product Description
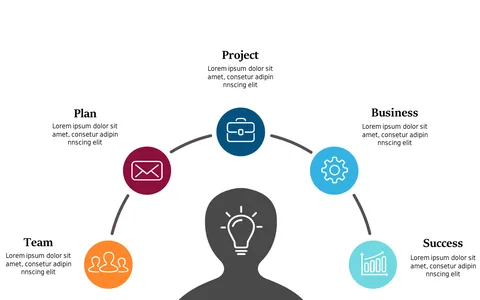
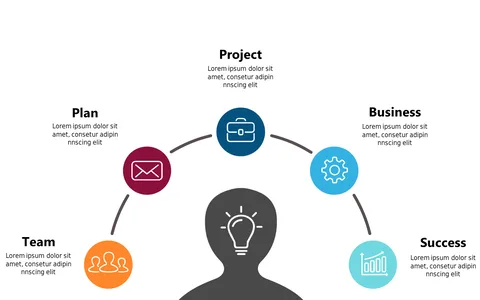
Keeping track of various project phases can quickly become disorganized, making it hard to ensure everyone is on the same page. This slide presents a circular timeline that effectively illustrates the five key phases of project management: Initiation, Planning, Execution, Control, and Closure, offering a clear view of the project lifecycle.
This layout works wonders for project managers, operations directors, and event planners during strategy sessions or team briefings. By organizing the project phases in a circular format, you can highlight how each part interconnects, helping your team see the bigger picture more effectively.
For only $0.99, this slide is available for instant download and is fully editable in PowerPoint and Google Slides. It’s simple to customize, making it ready to use in just a few minutes.
$0.99 – Purchase Checkout
Added to cart