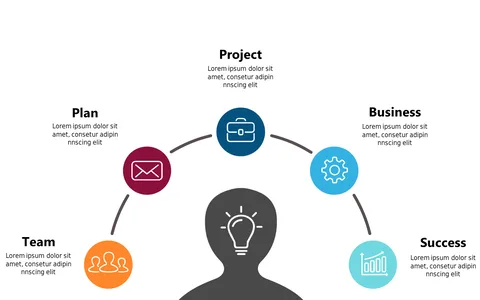
Colorful Circular Diagram for Project Phases
Product Description
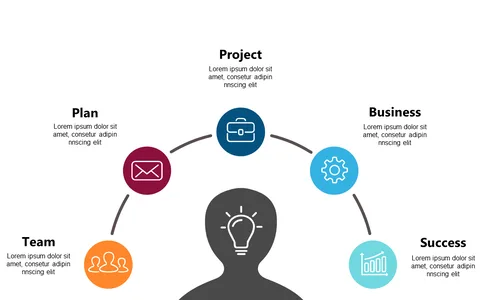
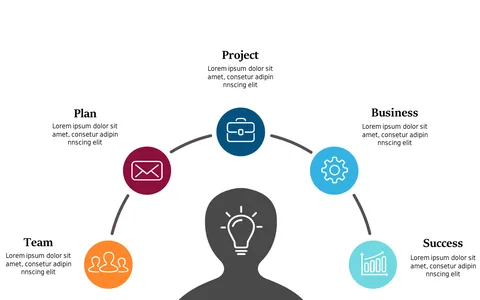
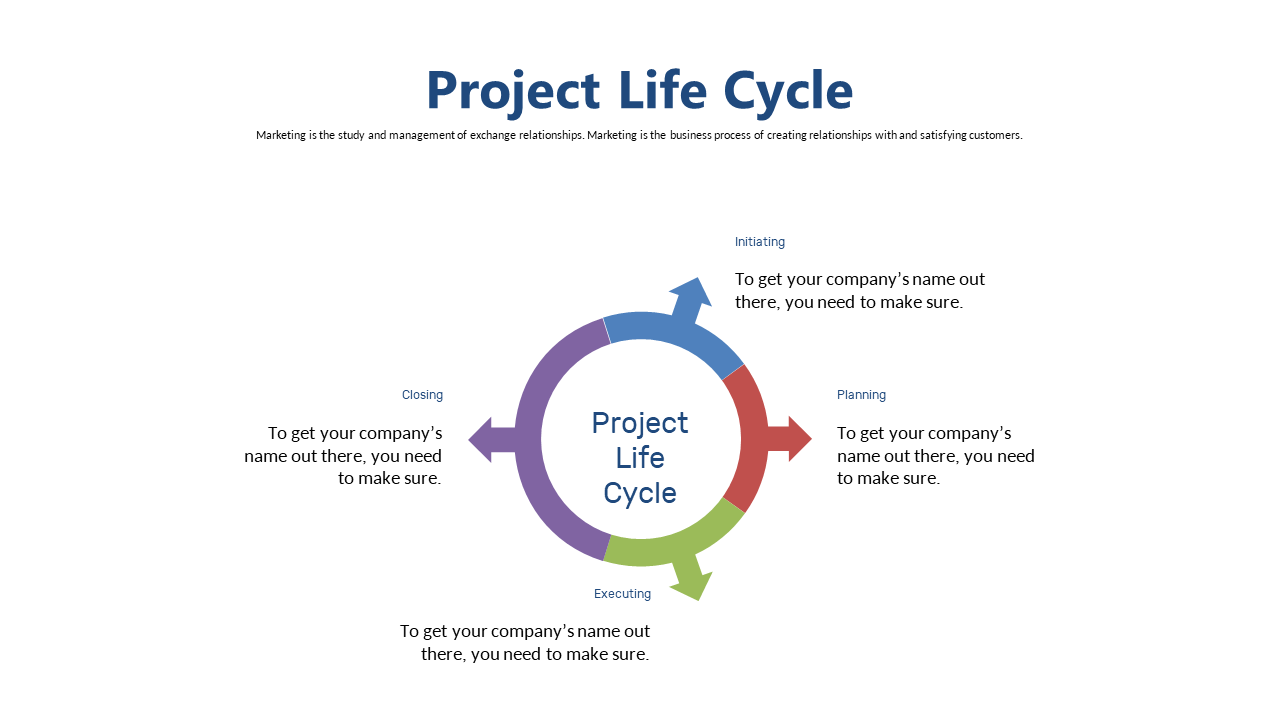
Conveying the phases of a project can be challenging, especially when your audience needs to digest information quickly. The colorful circular diagram simplifies this process, allowing you to visually represent the life cycle of your project in an engaging way. Clear visuals help ensure that everyone understands their roles in each stage.
Team leads in tech firms or marketing agencies will find this slide particularly useful during project kick-off meetings or status updates. You can easily present the stages of Initiating, Planning, Executing, and Closing, ensuring that your team and clients are aligned on expectations.
This design not only captures attention but also encourages active participation from your audience. Grab this slide for just $0.99, and enjoy the ease of editing in PowerPoint or Google Slides. You’ll be ready to present in no time!
$0.99 – Purchase Checkout
Added to cart