Showcase Project Processes with Circular Design
Product Description
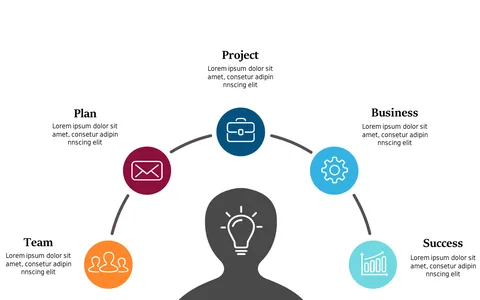
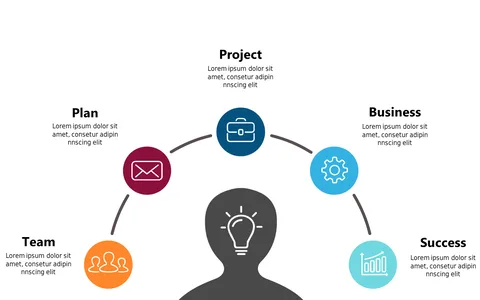
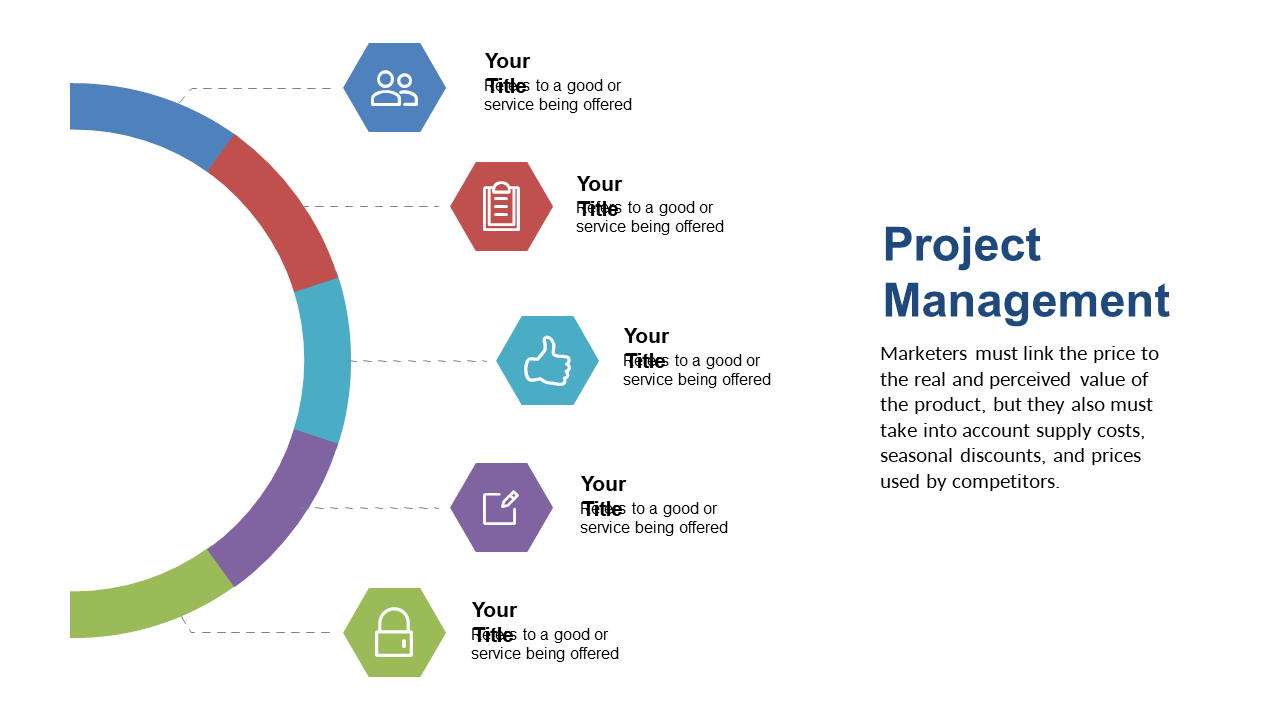
Finding a straightforward way to present project processes can be a challenge, especially when you want to ensure everyone understands complex information. This slide’s vibrant circular design makes it easy to break down intricate details into digestible parts, promoting clear communication among team members.
Project managers, team leaders, and even business analysts can use this slide during project kick-off meetings or status updates. It’s perfect for scenarios where you need to showcase the flow of processes, whether in tech, construction, or any project-driven industry.
For just $0.99, you can download this slide instantly. It’s fully editable in PowerPoint and Google Slides, allowing you to customize it to fit your specific project needs in minutes.
$0.99 – Purchase Checkout
Added to cart