Visualize Business Strategies with Circular Process Diagram
Product Description
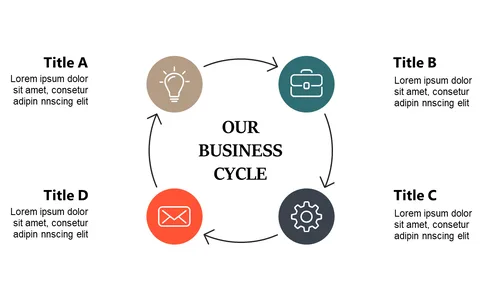
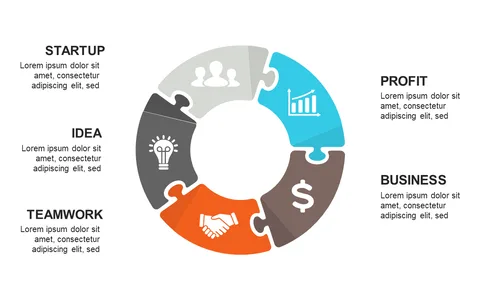
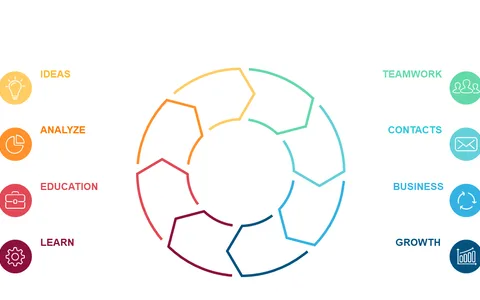
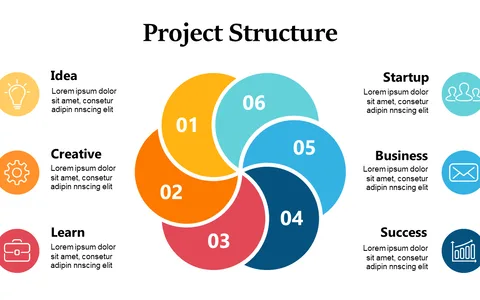
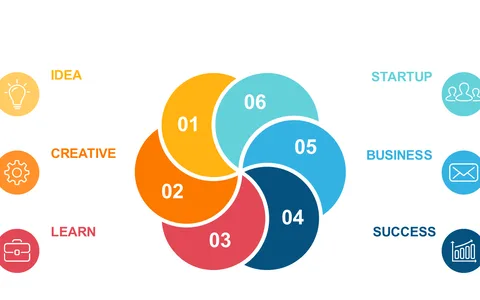
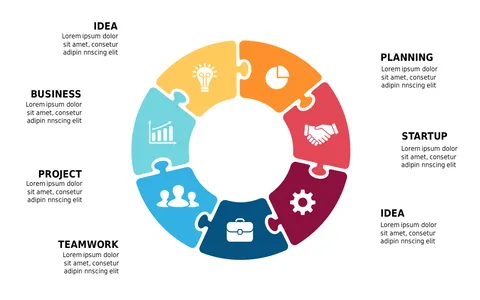
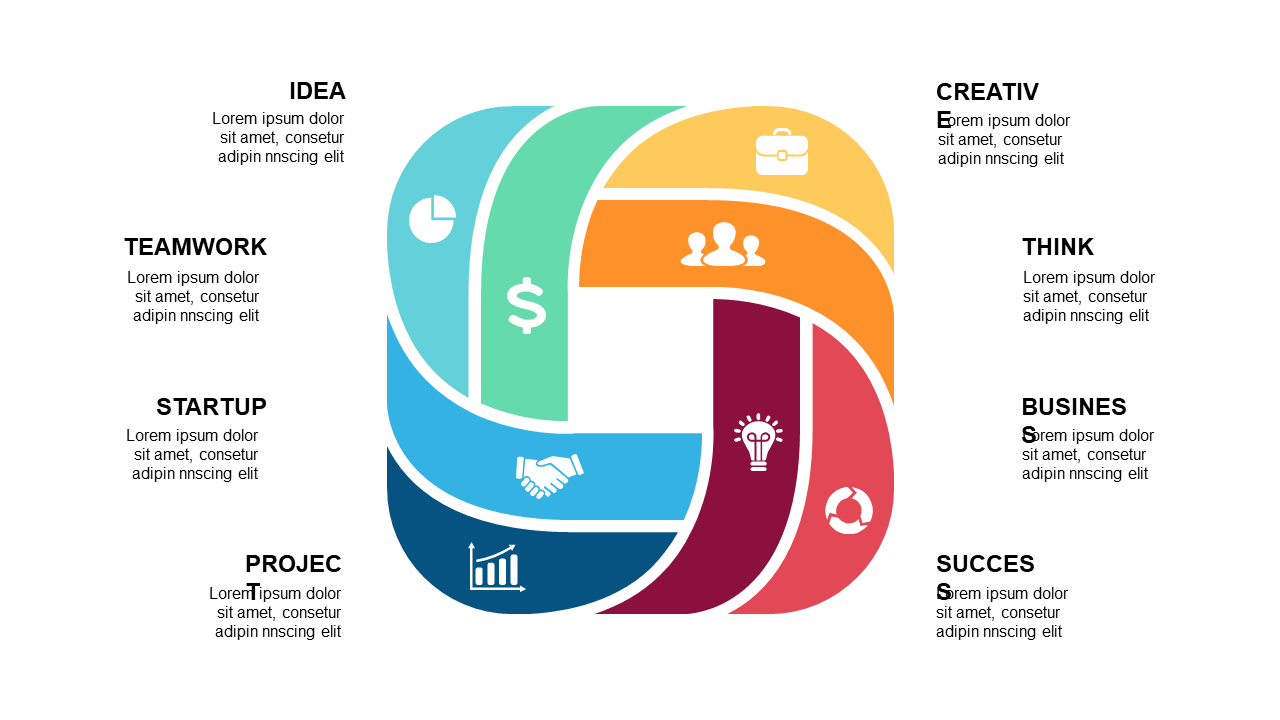
Communicating intricate business strategies can often lead to confusion if not presented clearly. This circular process diagram serves as a vibrant tool to visualize complex workflows, ensuring your audience grasps the essential points without getting lost in technical jargon.
Its design makes complex ideas accessible and engaging. You’ll find this slide useful whether you’re a project manager leading a strategic planning meeting or a marketing director presenting a new campaign workflow. It’s perfect for professionals in any industry that requires clear communication of multi-step processes, such as finance, operations, or product development teams working on initiatives.
Available for just $0.99, this slide is ready for instant download and is easily editable in both PowerPoint and Google Slides. Transform your presentations in minutes and captivate your audience with clear visual representations.
$0.99 – Purchase Checkout
Added to cart