Outline Business Workflows with a Circular Diagram

Product Description
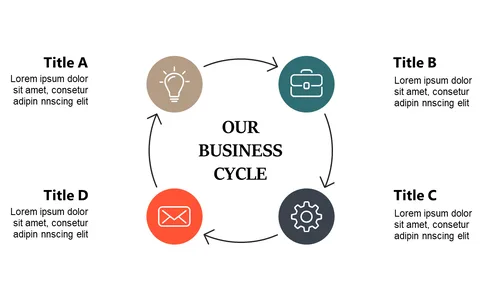
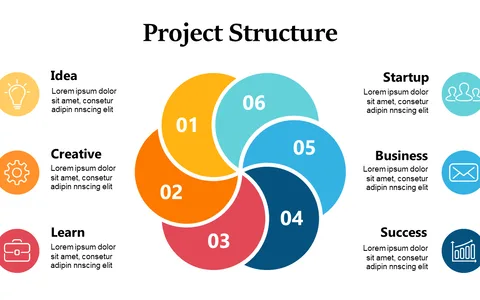
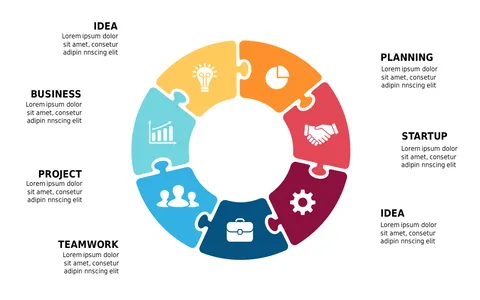
When your projects get complicated, it’s essential to have visual aids that help clarify your workflows. This circular diagram provides an intuitive layout to outline intricate processes, ensuring that your audience comprehends each step without confusion.
It’s a great way to enhance understanding when discussing multifaceted topics. This slide is perfect for operations managers defining workflow steps, business analysts illustrating process improvements, or team leads presenting project timelines in meetings. Picture how this clear representation could guide your audience through complex information during a status update or strategic planning session.
For just $0.99, you can immediately download this engaging slide. It’s easy to customize in PowerPoint and Google Slides, allowing you to get your presentation ready in no time.
$0.99 – Purchase Checkout
Added to cart