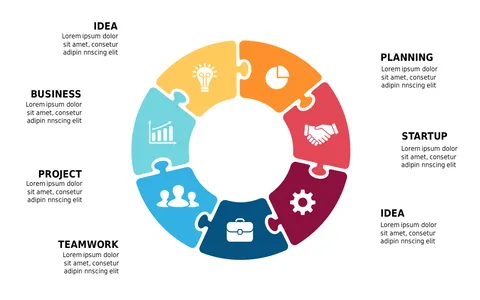
Showcase Processes with a Vibrant Circular Diagram
Product Description
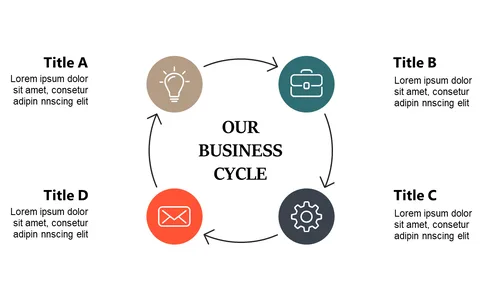
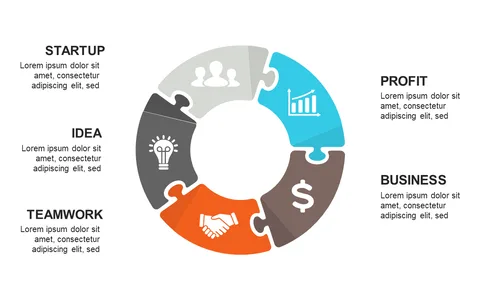
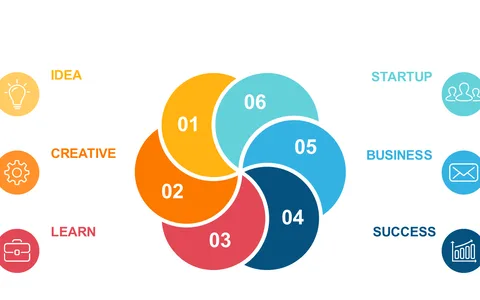
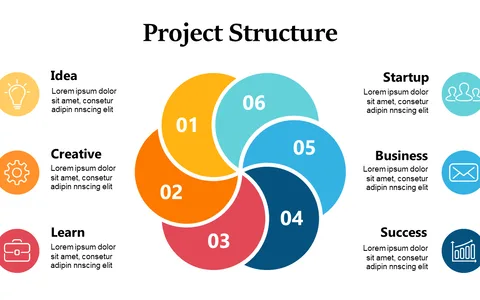
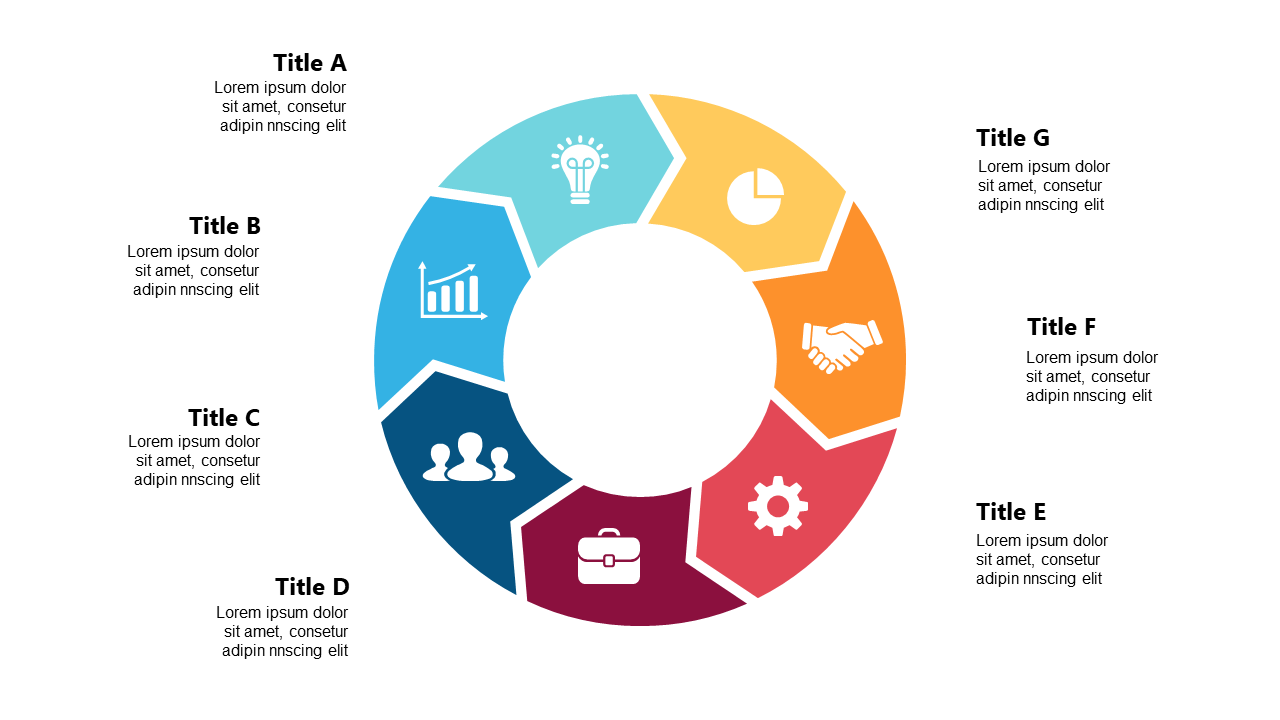
Conveying complicated processes in a way that keeps your audience engaged can be a daunting task. This vibrant circular diagram simplifies that by organizing information into clear, colorful segments, making your presentation not only informative but visually appealing as well. It’s the perfect solution to ensure your message is not lost in a sea of text.
Whether you’re a project manager outlining a new initiative, a marketing lead presenting a campaign workflow, or a business analyst explaining data trends, this diagram fits right in. Imagine showcasing your key business processes in a team meeting or client presentation where clarity is paramount.
The distinct icons will help your audience grasp concepts quickly. For just $0.99, you can instantly download this eye-catching slide, which is easy to edit in both PowerPoint and Google Slides. Quickly make it your own and have a polished presentation ready in minutes.
$0.99 – Purchase Checkout
Added to cart