Visualize Processes with Colorful Circular Cycle Diagram

Product Description
When you’re dealing with complex processes, effective communication is key to ensuring everyone is on the same page. It can be easy for details to get lost in lengthy explanations.
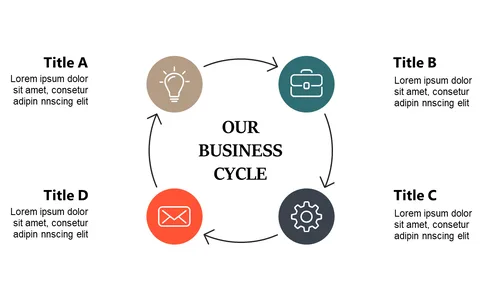
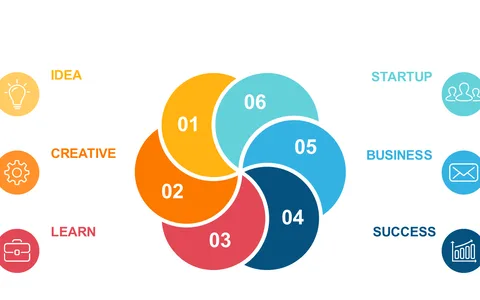
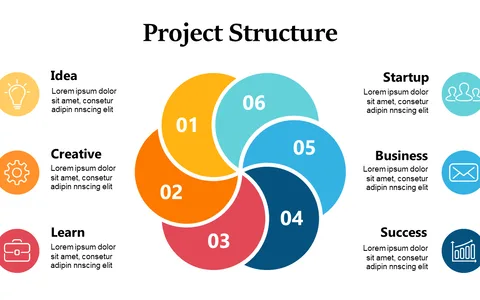
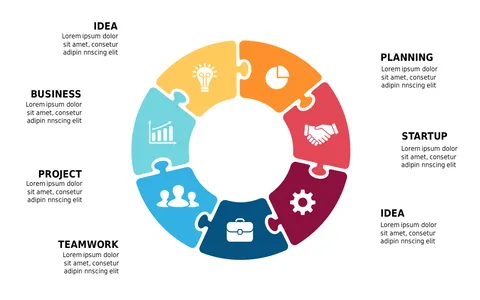
This colorful circular cycle diagram provides a vibrant and intuitive way to visualize intricate processes, making them easier to digest. This slide is perfect for operations managers, project coordinators, and educators who want to illustrate workflows, project cycles, or training modules. It can be used in workshops, team meetings, or even in classrooms to provide clarity and engagement around complex topics.
For just $0.99, you can instantly download this slide and edit it in PowerPoint or Google Slides. It’s designed for quick customization, so you can have an engaging presentation ready in no time.
$0.99 – Purchase Checkout
Added to cart