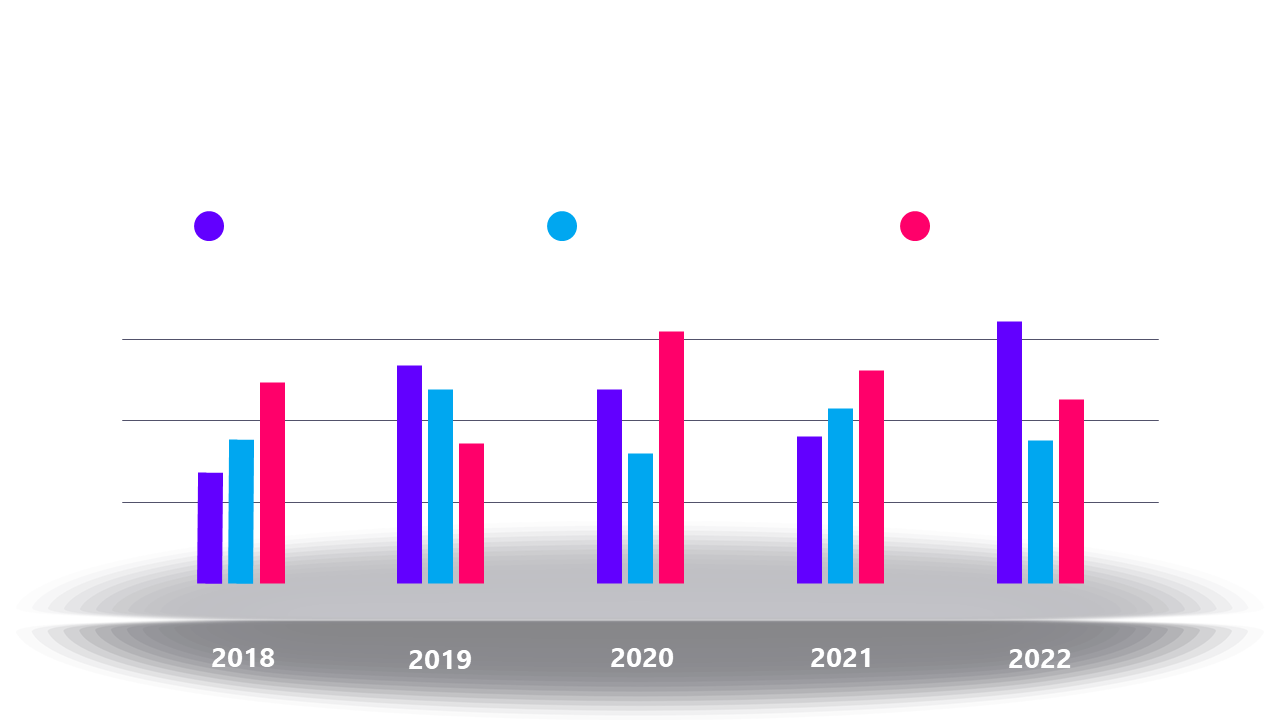
Colorful Bar Chart for Annual Data Comparison
Product Description
Presenting annual data comparisons can often feel overwhelming, especially when you have to convey complex information to your audience. With this vibrant bar chart, you can visually compare financial performance or sales growth across multiple years, making it easy for your audience to grasp key insights at a glance.
This slide is perfect for financial analysts preparing year-end reviews, sales managers discussing quarterly trends, or marketing professionals evaluating campaign performance over time. Whether you’re in a board meeting, a quarterly review, or a budget planning session, this chart will enhance your message and engage your viewers.
For just $0.99, you can download this slide instantly and start customizing it right away. It’s easy to edit in PowerPoint and Google Slides, so you can make adjustments in just minutes to tailor it to your specific needs.
$0.99 – Purchase Checkout
Added to cart







