Engaging Vertical Bar Chart for Data Presentation
Product Description
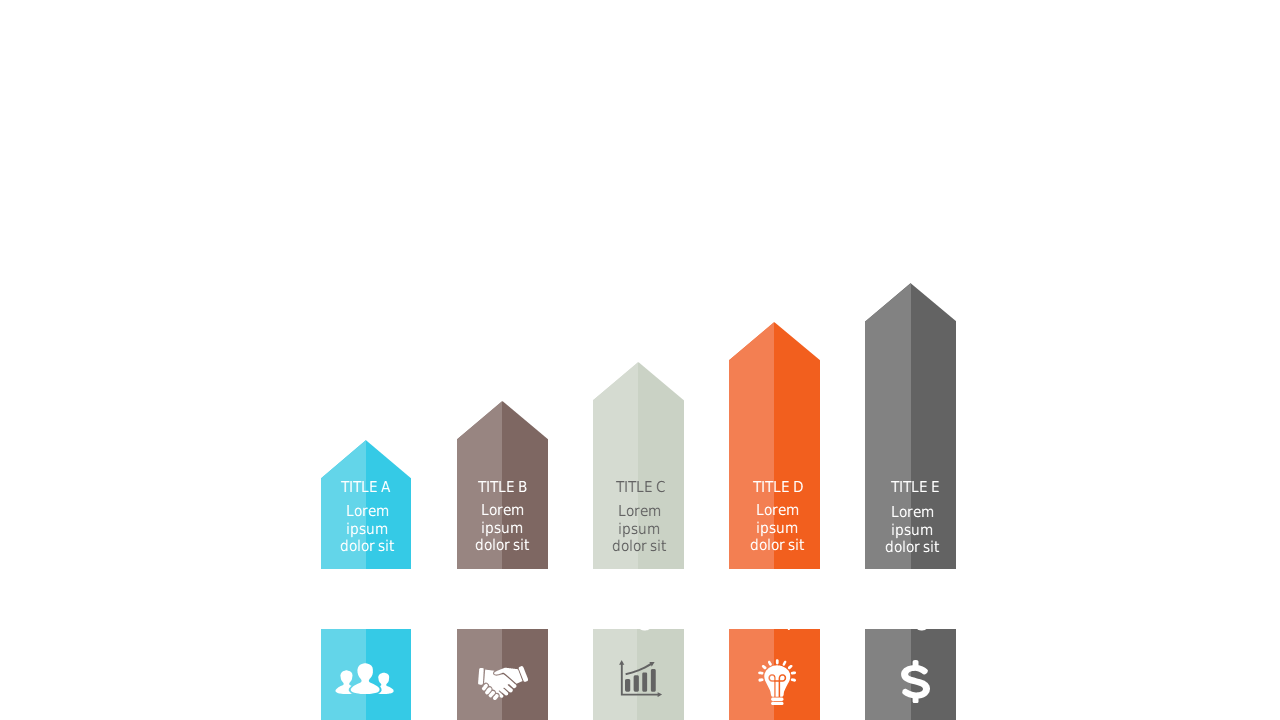
Keeping your audience engaged while presenting data can be a challenge, especially when the numbers are dense. This engaging vertical bar chart slide transforms complex statistics into a visual narrative that captivates viewers.
The colorful bars, complemented by icons, provide a clear representation of your data at a glance. Sales analysts presenting quarterly results will find this slide essential, as will team leaders summarizing project metrics in progress updates. This format is also ideal for financial consultants showcasing performance trends to clients, ensuring the data is not only informative but also visually appealing.
For only $0.99, you can download this slide instantly and customize it in PowerPoint or Google Slides. Make your data presentations stand out effortlessly!
$0.99 – Purchase Checkout
Added to cart







