Present Data Clearly with Segmented Bar Chart
Product Description
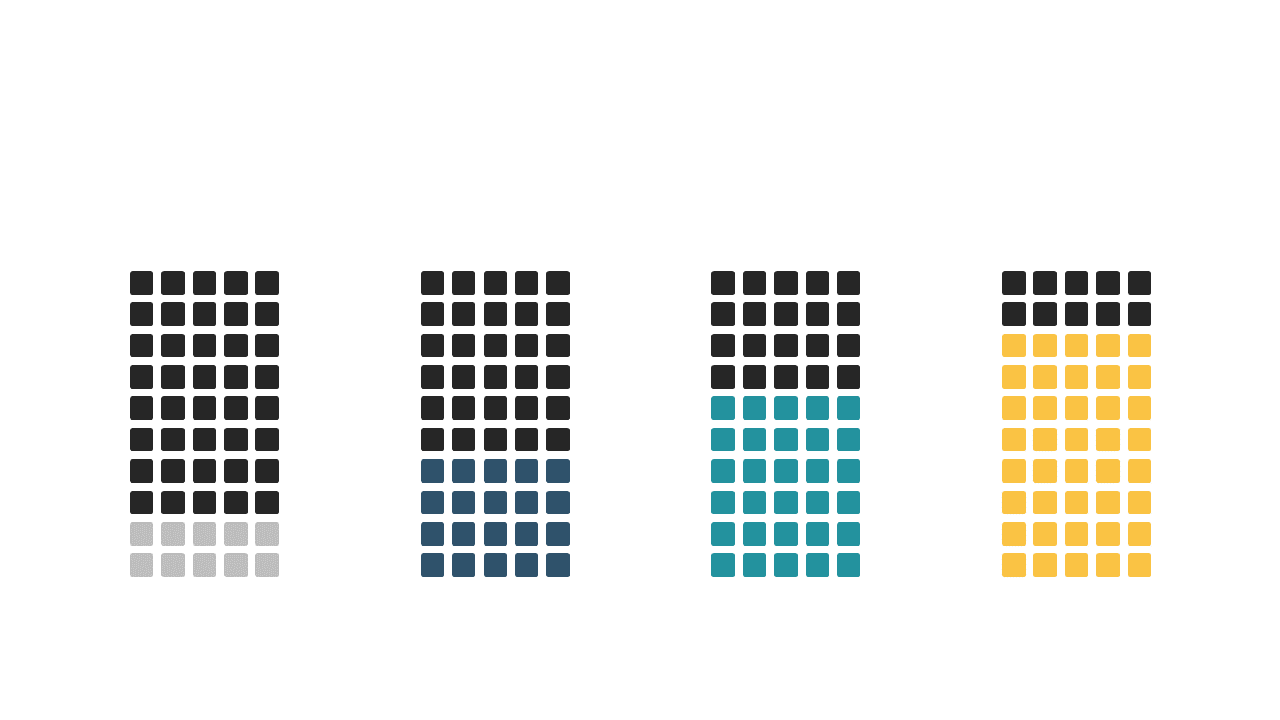
Explaining complex data in a straightforward manner can often feel like trying to untangle a mess of wires. This segmented bar chart slide simplifies your data presentation, using varying shades to help your audience see comparisons at a glance.
The clear visual breakdown ensures that your key points come across without confusion. Perfect for marketing analysts, product managers, or finance teams, this slide is great for presentations where data interpretation is crucial. Whether you’re analyzing customer feedback or comparing budget allocations, this chart will help you make compelling arguments that resonate with your audience.
At just $0.99, you can instantly download this slide and customize it easily in PowerPoint or Google Slides. Get ready to present your findings clearly and effectively in no time.
$0.99 – Purchase Checkout
Added to cart







