Display Progress with Color-Coded Bar Charts
Product Description
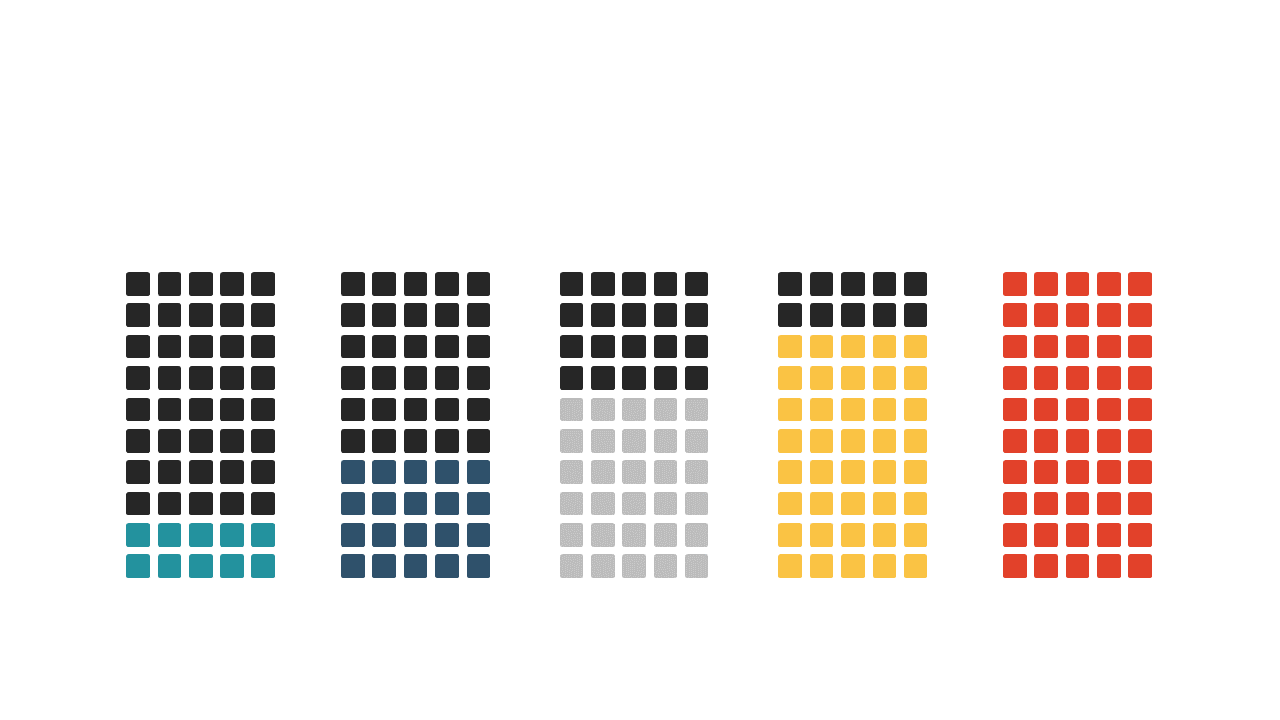
As a finance lead, you know that conveying complex data clearly is paramount to driving decisions. This slide, featuring color-coded bar charts, takes the guesswork out of understanding key performance indicators.
Immediate visual cues allow your audience to grasp essential information at a glance, making discussions more productive. You’ll find this slide particularly useful during budget reviews, quarterly earnings calls, or performance assessments. It’s an essential tool for financial analysts and project leads looking to communicate progress and results in a visually appealing way.
For only $0.99, you can download this slide instantly and make quick edits in PowerPoint or Google Slides. Get your insights across clearly and efficiently, helping your audience focus on what truly matters.
$0.99 – Purchase Checkout
Added to cart







