Showcase Milestones with Circular Timeline Layout

Product Description
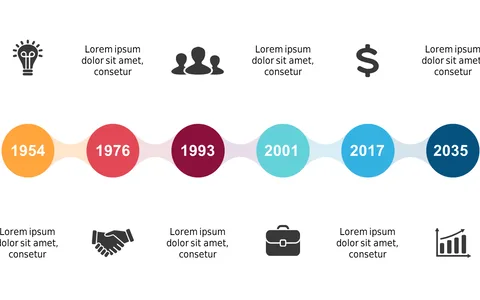
Keeping everyone informed about project milestones can be a daunting task, especially when you’re faced with tight timelines. This circular timeline layout makes it easy to illustrate your progress visually, helping your audience understand how far you’ve come and what’s next.
Your updates will become more engaging and meaningful. Use this slide when presenting quarterly updates as a project manager, during stakeholder meetings as a product lead, or while reviewing timelines in a strategic planning session. It’s a versatile tool that helps ensure all parties are on the same page regarding project timelines.
For only $0.99, you can download this slide immediately and personalize it to your liking. It’s fully editable in both PowerPoint and Google Slides, making it a breeze to update and share with your team in no time.
$0.99 – Purchase Checkout
Added to cart