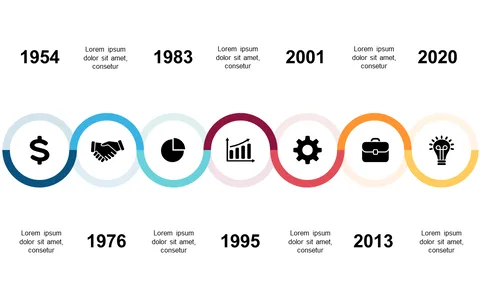
Showcase Historical Data with a Circular Timeline
Product Description
Presenting historical data can often be overwhelming for your audience, especially when trying to convey timelines and key milestones. A well-designed circular timeline helps to simplify this complexity, transforming intricate information into a visual story that is easy to understand.
This slide allows you to highlight significant years, making your data not just informative but also engaging. This slide is perfect for project managers delivering end-of-year reports, marketing professionals illustrating campaign timelines, or educators showcasing historical events. Whether you’re in a board meeting, a classroom, or a client presentation, this format captures attention and aids retention by visually marking important milestones that stand out.
For just $0.99, you can download this slide instantly and edit it in PowerPoint or Google Slides. Tailor it to your specific needs and get your message across clearly in minutes.
$0.99 – Purchase Checkout
Added to cart