Visualize Key Dates with Circular Timeline

Product Description
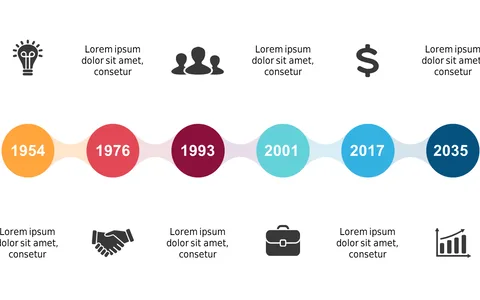
Finding the right way to visualize key dates can be tricky, especially when you want to maintain clarity and engagement. This circular timeline slide provides a clear layout to illustrate important milestones chronologically, making it easier for your audience to follow along.
It transforms complex data into a visually appealing format that captures attention. This slide is perfect for event planners outlining schedules for conferences, financial analysts presenting fiscal timelines, or educators summarizing historical events in lessons. No matter your field, if you’re tasked with keeping an audience engaged while sharing chronological information, this slide will serve you well.
At just $0.99, you can instantly download this slide and tailor it to your needs in PowerPoint or Google Slides. Editing colors and dates is straightforward, so you’ll be ready to impress your audience in just a few minutes.
$0.99 – Purchase Checkout
Added to cart