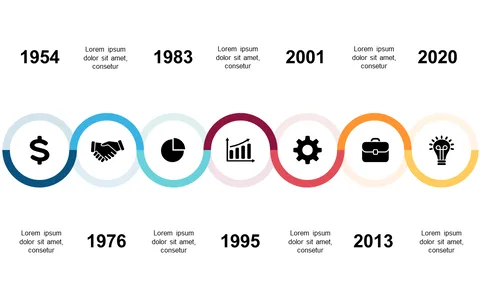
Showcase Milestones with a Circular Timeline Layout

Product Description
When showcasing critical milestones in your project, a powerful visual representation can enhance understanding and retention. This circular timeline layout combines clarity with engagement, allowing you to illustrate key years and achievements effectively.
Each milestone is complemented by icons, making your timeline not only informative but visually compelling. Consider using this slide if you’re an event manager tracking a project’s timeline, a sales director revealing quarterly milestones, or an educator highlighting significant historical developments. It’s an excellent tool for meetings, presentations, or reports where clarity and impact are needed to convey progress successfully.
For just $0.99, you can download this slide instantly and edit it in both PowerPoint and Google Slides. Get started on crafting your engaging presentation in just minutes.
$0.99 – Purchase Checkout
Added to cart