Dynamic Circular Process Diagrams for Business Strategy
Product Description
In a fast-paced work environment, business analysts often face the challenge of presenting complex cyclical processes clearly and engagingly. Confusion can arise in conveying intricate ideas, making it harder for your audience to grasp essential concepts.
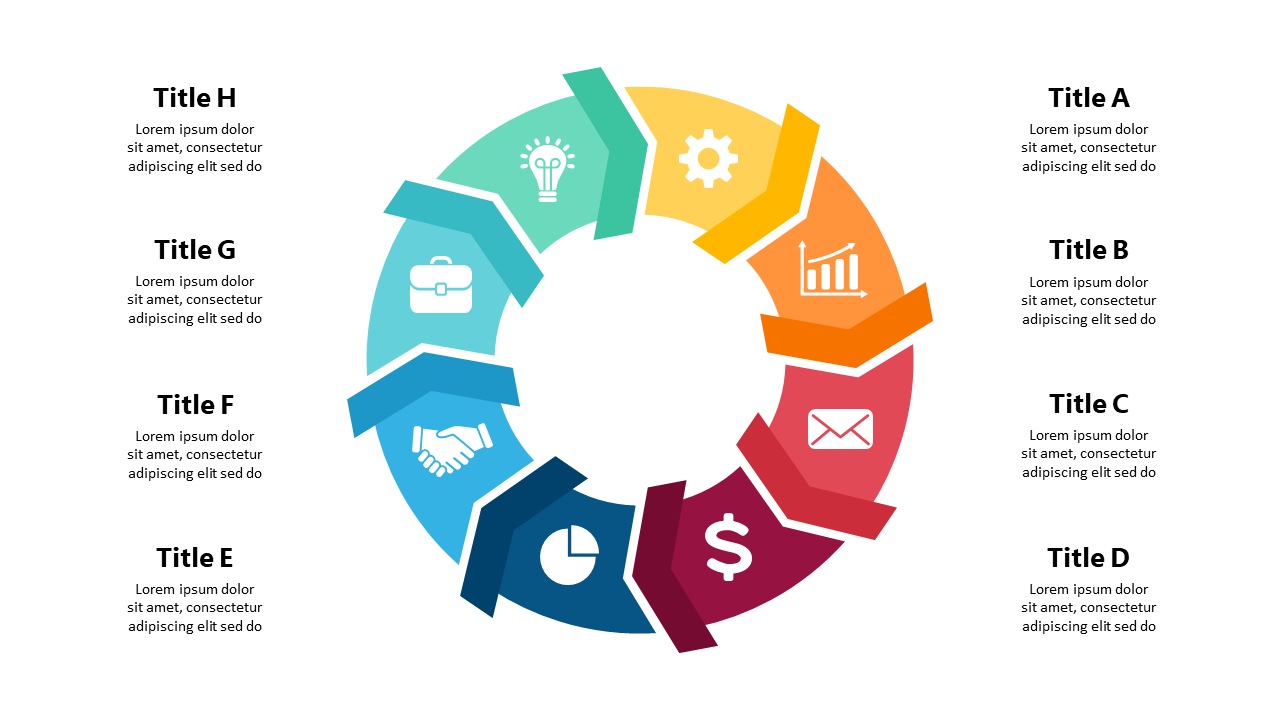
This dynamic circular process diagram breaks down those complexities with vivid segments and icons, guiding your audience through crucial business principles. Utilize this slide when presenting to executive teams, during strategy workshops, or while collaborating with cross-functional teams to illustrate the interconnectedness of various business elements. It’s perfect for analysts in finance, marketing, or operations who need to discuss cyclical trends and strategies in an engaging manner.
For only $0.99, you can download this slide immediately and edit it in PowerPoint or Google Slides. Its straightforward customization options allow you to highlight the key points that matter most to your audience in just minutes.
$0.99 – Purchase Checkout
Added to cart







