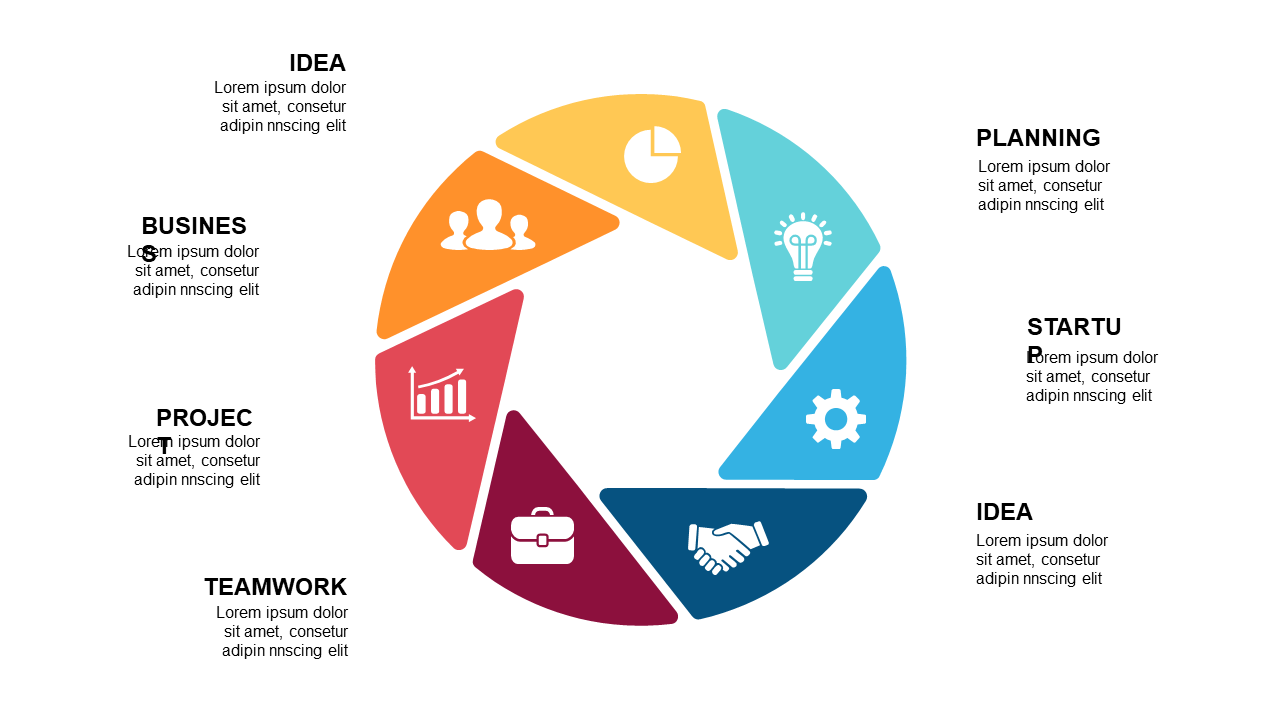
Visualize Ideas with 8-Segment Circular Process Diagram
Product Description
Presenting ideas or stages in a project can become convoluted without a clear visual representation. A structured diagram helps your audience follow along, enhancing their understanding of your workflow or project phases.
When clarity is prioritized, you ensure that your points resonate effectively. The 8-Segment Circular Process Diagram is great for project managers detailing different phases of a project, team leaders mapping out collaborative processes, or marketers illustrating various stages of a campaign. This slide is versatile and fits perfectly into various business contexts where clear communication is vital.
For just $0.99, you can download this slide right away. It’s fully editable in PowerPoint and Google Slides, allowing you to tailor the segments and text to fit your specific project needs in minutes.
$0.99 – Purchase Checkout
Added to cart







