Represent Financial Growth with Circular Cycle Diagram

Product Description
Communicating financial growth strategies requires precision and clarity, but it can often be challenging to present this information in an engaging way. When growth opportunities are muddled with detail, stakeholders can lose sight of the big picture.
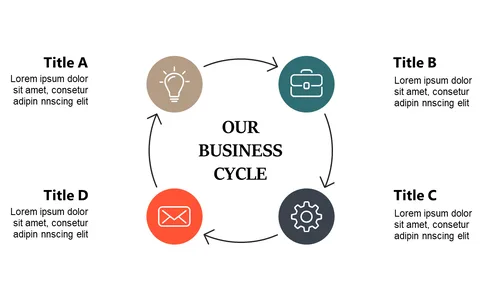
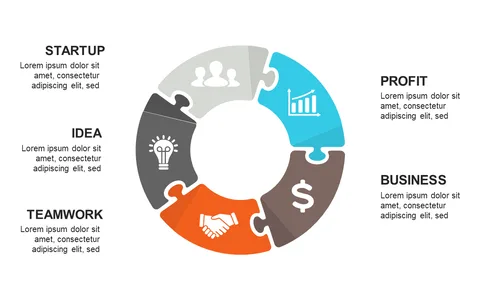
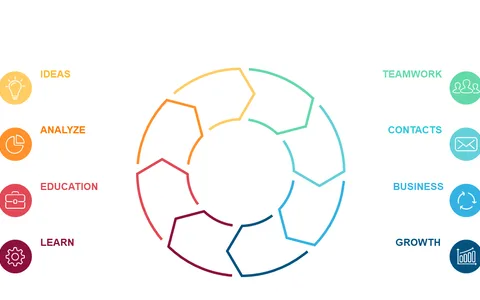
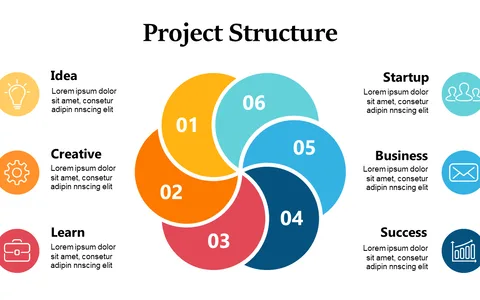
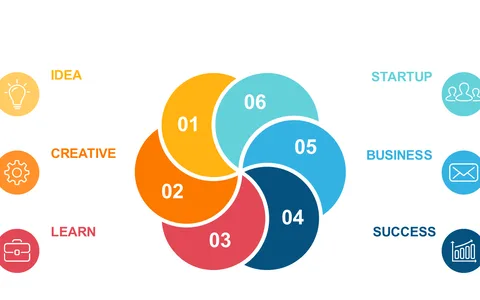
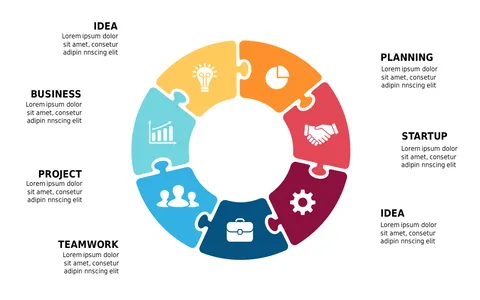
This circular cycle diagram simplifies the process, making it easy to articulate financial progress visually. This slide is perfect for finance professionals, investment analysts, and business strategists during quarterly reviews, financial planning meetings, or investor presentations. You can effectively illustrate the various stages of growth and highlight key milestones, ensuring that all participants stay aligned on objectives and progress.
For just $0.99, you can download this slide immediately and edit it to match your specific needs in PowerPoint or Google Slides. Get set to enhance your financial presentations and make an impact in just minutes.
$0.99 – Purchase Checkout
Added to cart