Circular Infographic for Customer Journey Stages
Product Description
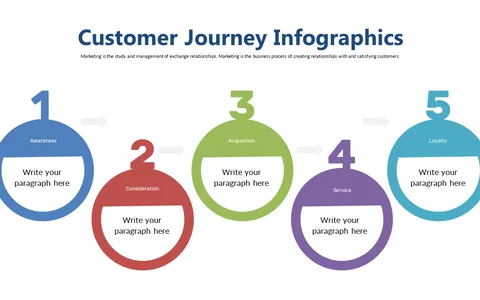
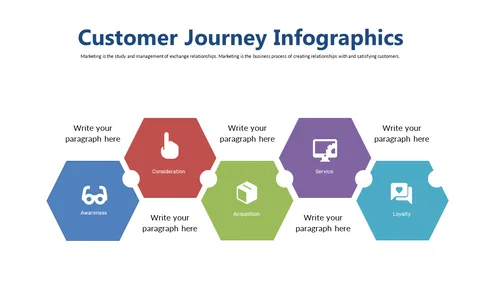
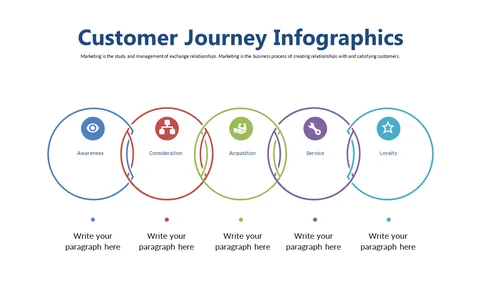
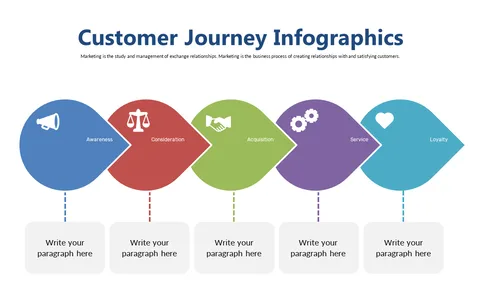
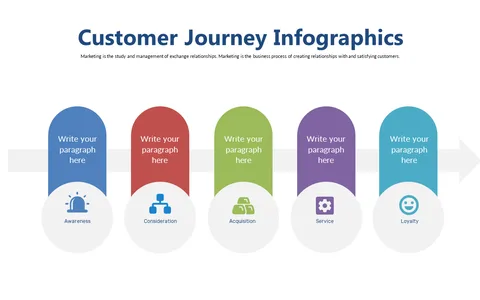
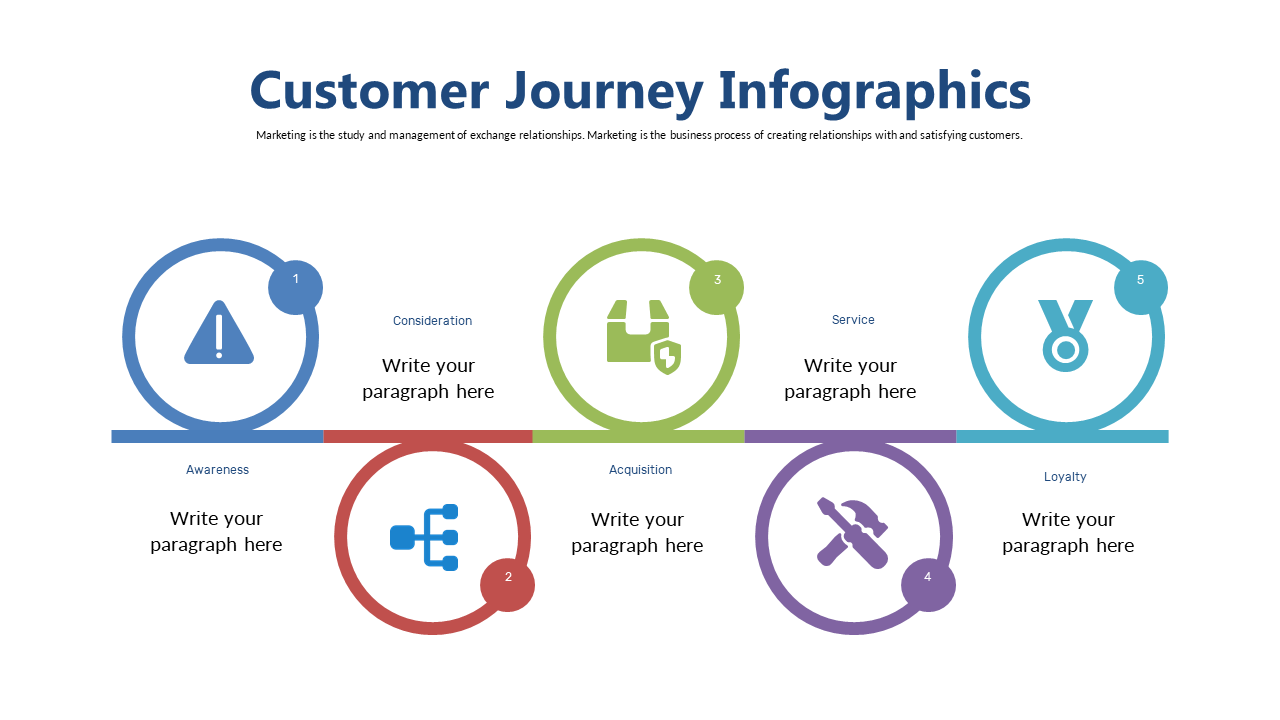
Conveying the stages of the customer journey can feel overwhelming when you’re trying to keep everyone on the same page. This circular infographic simplifies that complexity by visually outlining the journey from awareness to loyalty, ensuring your audience grasps the information easily.
Marketing managers in retail, customer service leaders in tech, and sales professionals in any industry can all benefit from this slide during presentations or strategy meetings. Use it to discuss customer touchpoints during quarterly reviews or to train your team on best practices in customer experience.
For just $0.99, you can instantly download this slide and make it your own. It’s fully editable in PowerPoint and Google Slides, so
you can customize it in just a few minutes.
$0.99 – Purchase Checkout
Added to cart