Customize Your 8-Section Process Diagram
Product Description
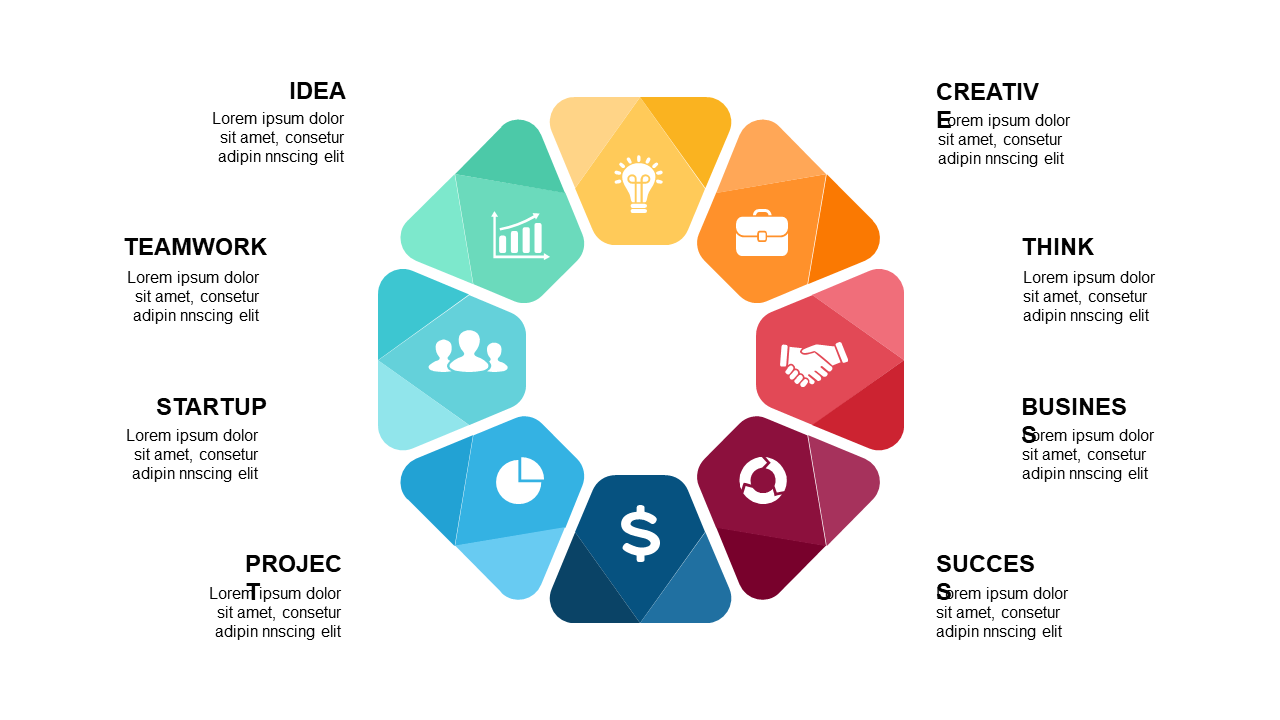
Conveying complex processes can be daunting, especially when you need to distill intricate details into something easily digestible. With this engaging eight-section process diagram, you can present multifaceted concepts in a clear and visually appealing way.
Each segment is thoughtfully designed to symbolize a specific element, making understanding easier for your audience. This slide is perfect for project managers who need to explain a project lifecycle, business analysts presenting workflow optimizations, or team leaders conducting training sessions. Whether you’re in tech, finance, or healthcare, this diagram will help clarify the various components of your process while maintaining the attention of your audience.
For just $0.99, you can instantly download this slide, which is easy to edit in both PowerPoint and Google Slides. Enhance your presentations in minutes with a tool designed to communicate effectively.
$0.99 – Purchase Checkout
Added to cart







