Customer Communication Flow Visualization
Product Description
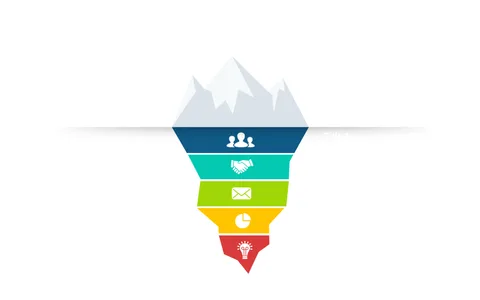
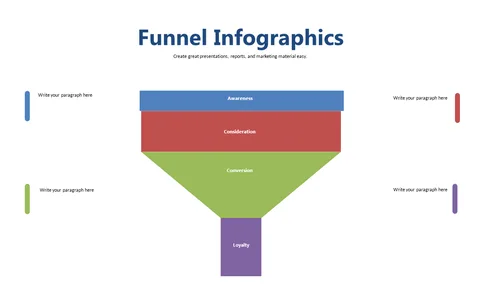
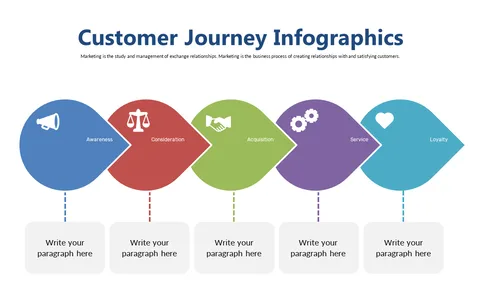
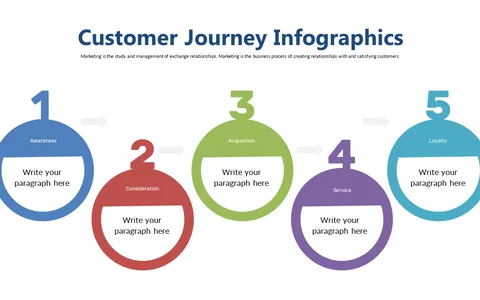
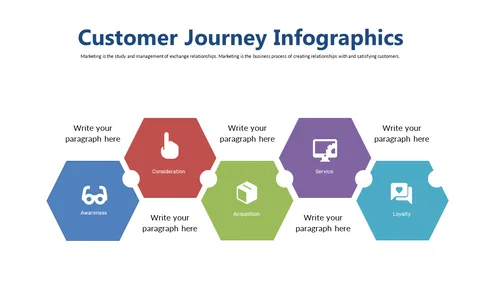
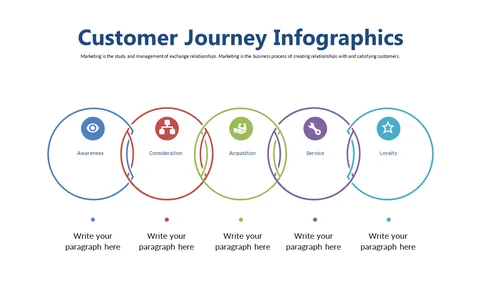
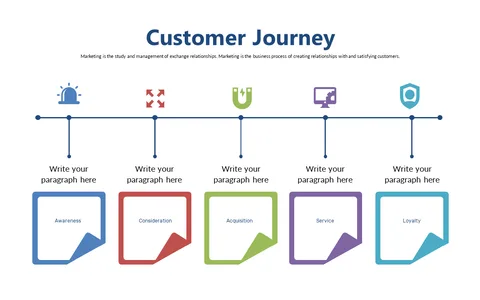
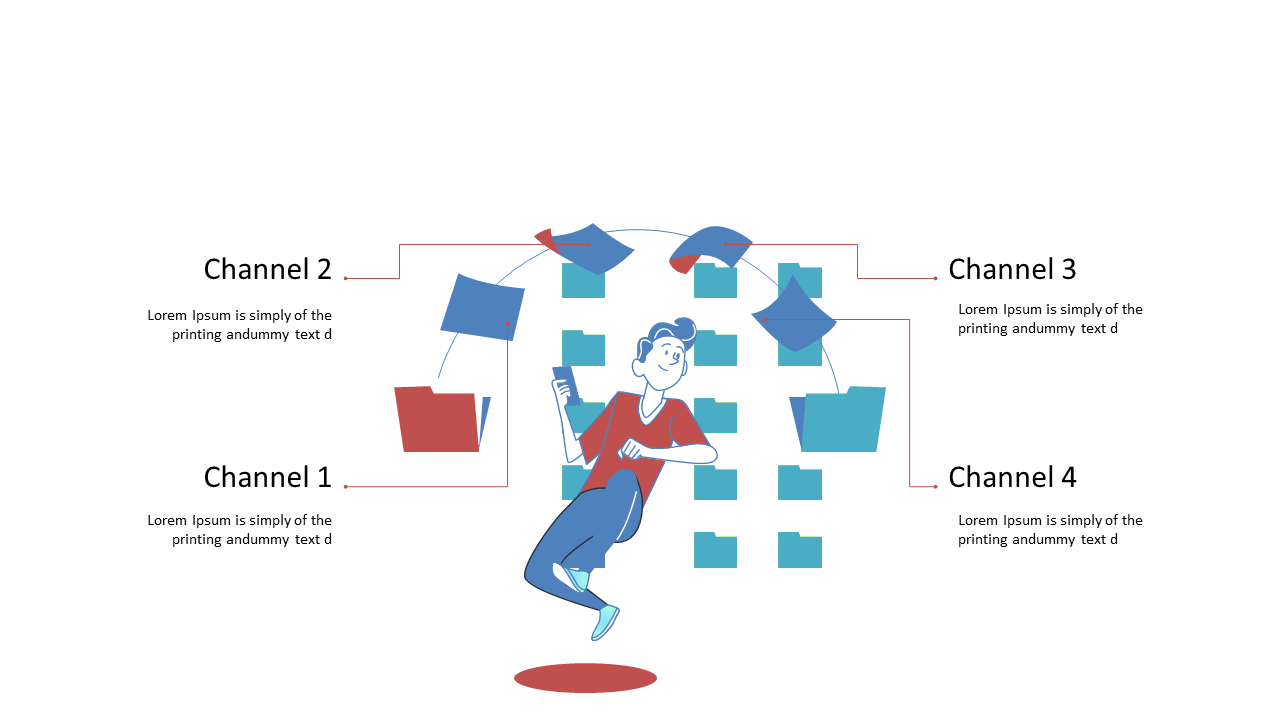
Communicating the customer journey can often resemble a tangled web of interactions that feels overwhelming. When you can’t effectively illustrate how customers connect with your brand, you risk losing their attention and understanding.
This slide offers a clean and engaging way to visualize those touchpoints, ensuring that everyone is on the same page. Marketing specialists, customer experience managers, and product designers can all benefit from this visualization during presentations to stakeholders or team meetings. Whether you’re mapping out user interactions for a new campaign or analyzing feedback loops in a project review, this slide makes it easier to present your findings clearly.
For only $0.99, you can grab this slide for instant download. It’s editable in PowerPoint and Google Slides, so you can adapt it to your own customer journey narrative in minutes.
$0.99 – Purchase Checkout
Added to cart