California Counties Map for Project Overview
Product Description
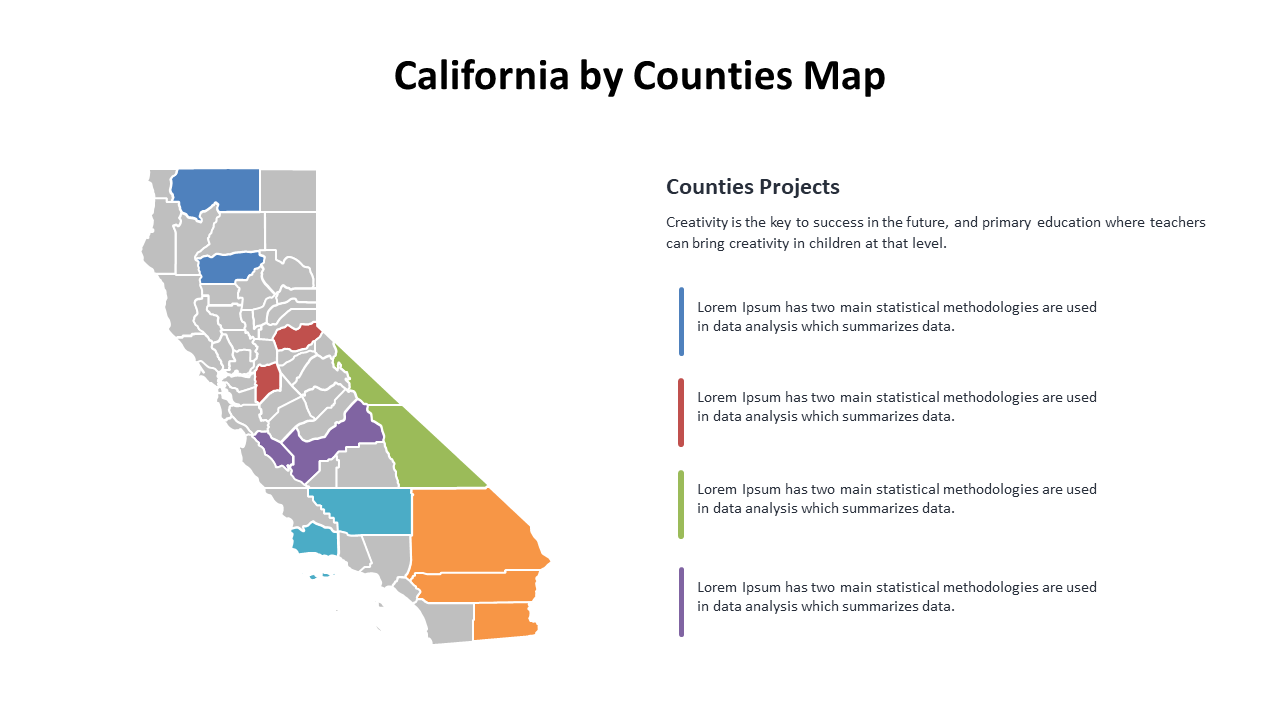
When you’re trying to explain a project that spans across various counties in California, a wall of text can be overwhelming. This map simplifies complex data, allowing you to present a visual representation that everyone can grasp quickly. With the counties clearly marked, your audience can easily follow along as you discuss specific aspects of the project.
This slide is perfect for project managers in construction, urban planning, or public health. Whether you’re running a kickoff meeting or presenting to city officials, having a map at your side will help your audience visualize the areas impacted by your project. Use it to highlight critical regions and foster engaging discussions.
For just $0.99, this slide is an instant download, making it easy to edit in PowerPoint or Google Slides.
You can customize colors and descriptions to match your project’s branding and specific needs, and it’s ready for your presentation in minutes.
$0.99 – Purchase Checkout
Added to cart







