California Counties Map for Educational Presentations
Product Description
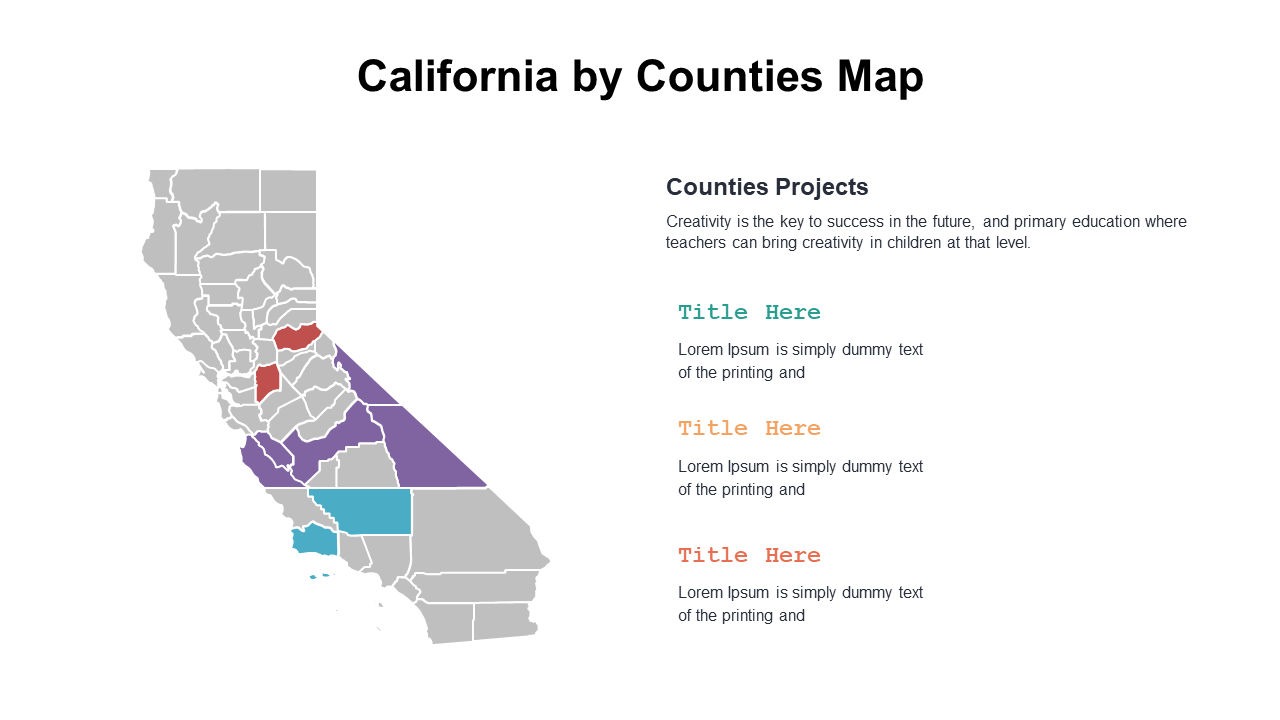
When tasked with presenting geographic data about California, relying solely on text can lead to confusion and disengagement. A well-crafted map simplifies complex information and helps your audience visualize the regional dynamics, keeping their attention focused. This California Counties Map makes your educational presentations far more effective by providing a clear visual reference.
Educators, trainers, and academic professionals can benefit greatly from this slide during lectures, workshops, or community outreach events. Use it to discuss environmental studies, demographics, or state resources, all while making your content more relatable and easy to understand.
It’s a great tool for professors, school administrators, or anyone needing to emphasize geographic relationships. At just $0.99, you can download this slide instantly and customize it to your content. It’s easily editable in PowerPoint and Google Slides, so you can tailor it to your specific educational goals and have it ready for your next presentation in no time.
$0.99 – Purchase Checkout
Added to cart







