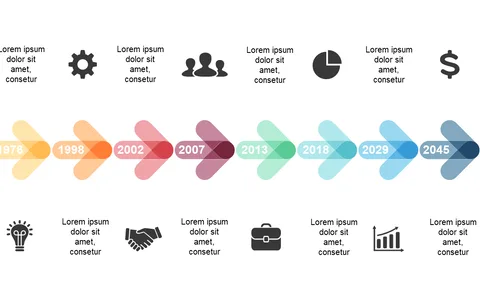
Present Key Milestones with Timeline V11

Product Description
Communicating the key milestones of a project can be tricky, especially when time is limited. This timeline slide allows operations managers to present pivotal moments in a visually appealing format, ensuring everyone understands the project’s path.
The clear markers and icons enhance comprehension, making your message stick. Use this slide for project updates in team meetings, status reports for clients, or presentations during strategic planning sessions. It’s designed for operations managers, project leaders, and team coordinators who need to highlight significant project developments efficiently.
For only $0.99, you can download this slide right now and edit it effortlessly in PowerPoint or Google Slides. You’ll have a polished visual ready to go in just minutes, making your next presentation a breeze.
$0.99 – Purchase Checkout
Added to cart