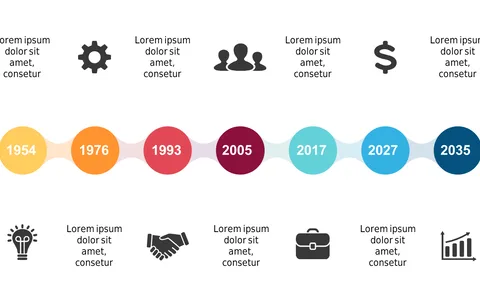
Present Key Milestones with Business Timeline Icons

Product Description
Presenting critical milestones can often feel overwhelming, especially when you want to keep your audience engaged. A clear visual representation can help you highlight your project’s most important points without losing your audience’s attention.
This timeline with distinct icons makes it easy for everyone to follow the flow of your project. Operations managers, project leads, and team coordinators will find this slide particularly useful when outlining project timelines during team meetings or client updates. Whether you’re describing the launch of a new product or detailing the phases of an operational overhaul, this visual aid helps ensure that everyone understands the milestones you’re discussing.
For just $0.99, you can download this slide instantly and start editing it in PowerPoint or Google Slides. It’s designed to be simple to customize, so you can quickly adapt it for your next presentation.
$0.99 – Purchase Checkout
Added to cart