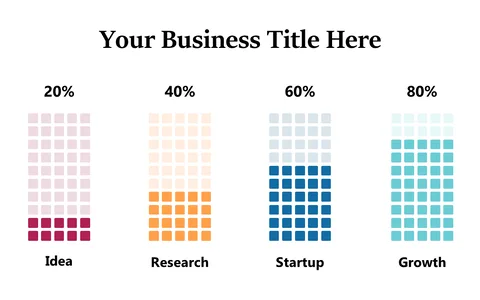
Showcase Business Growth with Arrow and Flag Design

Product Description
When time is of the essence, getting your message across clearly can feel daunting. This slide streamlines that process, using a straightforward design with an arrow leading to a flag to symbolize business growth effectively.
It captures the essence of your key performance indicators in a way that’s easy for your audience to follow. Perfect for business analysts in a fast-paced finance environment, growth strategists in tech companies, or product managers delivering updates at all-hands meetings, this slide supports a variety of contexts. Use it to highlight quarterly achievements or showcase milestones in your business development journey.
At just $0.99, this slide is available for instant download and can be easily edited in PowerPoint and Google Slides. Get ready to present your business growth confidently in minutes!
$0.99 – Purchase Checkout
Added to cart