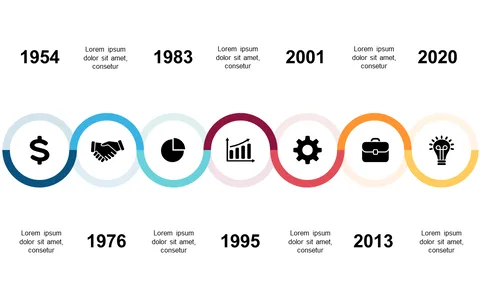
Track Progress with 4-Step Circular Timeline

Product Description
Keeping track of progress during a project can feel overwhelming, especially when juggling several milestones. This 4-step circular timeline slide provides a visually engaging way to display your progress at a glance, making it easy for your audience to follow along.
Each circular indicator highlights a key step, ensuring nothing gets overlooked. This slide is perfect for program managers reporting on project timelines, event planners coordinating multiple phases, or team leaders summarizing objectives at the end of a quarter. It’s a versatile tool for any meeting where visual tracking of progress is crucial to keeping everyone aligned.
At just $0.99, you can download this slide instantly and edit it easily in PowerPoint or Google Slides. It’s designed to help you convey your progress efficiently, allowing you to focus on what truly matters: delivering results.
$0.99 – Purchase Checkout
Added to cart