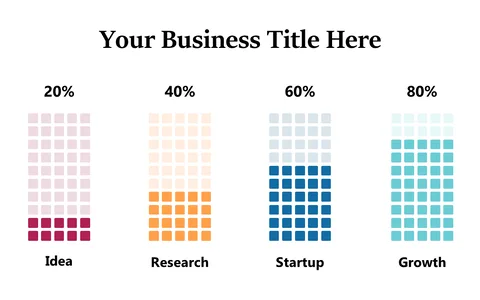
Outline Growth Stages with 4-Step Linear Chart

Product Description
Translating growth strategies into visual elements can be tricky, especially when you’re trying to convey a clear path to success. This 4-step linear chart provides a straightforward way to present your growth stages, guiding your audience from concept to accomplishment. Its clarity helps you illustrate key milestones effectively.
Entrepreneurs pitching their startups can benefit greatly from this slide, outlining their journey from idea to execution. Business strategists can also employ this chart in meetings to discuss expansion plans or performance reviews, making it a valuable asset in their presentation toolkit.
Whether you’re in finance, tech, or consulting, this slide is perfect for highlighting growth trajectories. At just $0.99, you can download this slide immediately and start editing it to fit your content in PowerPoint or Google Slides. With customizable features, you can make it your own in just a few minutes.
$0.99 – Purchase Checkout
Added to cart