Present Data with 3D Column Chart and Icons
Product Description
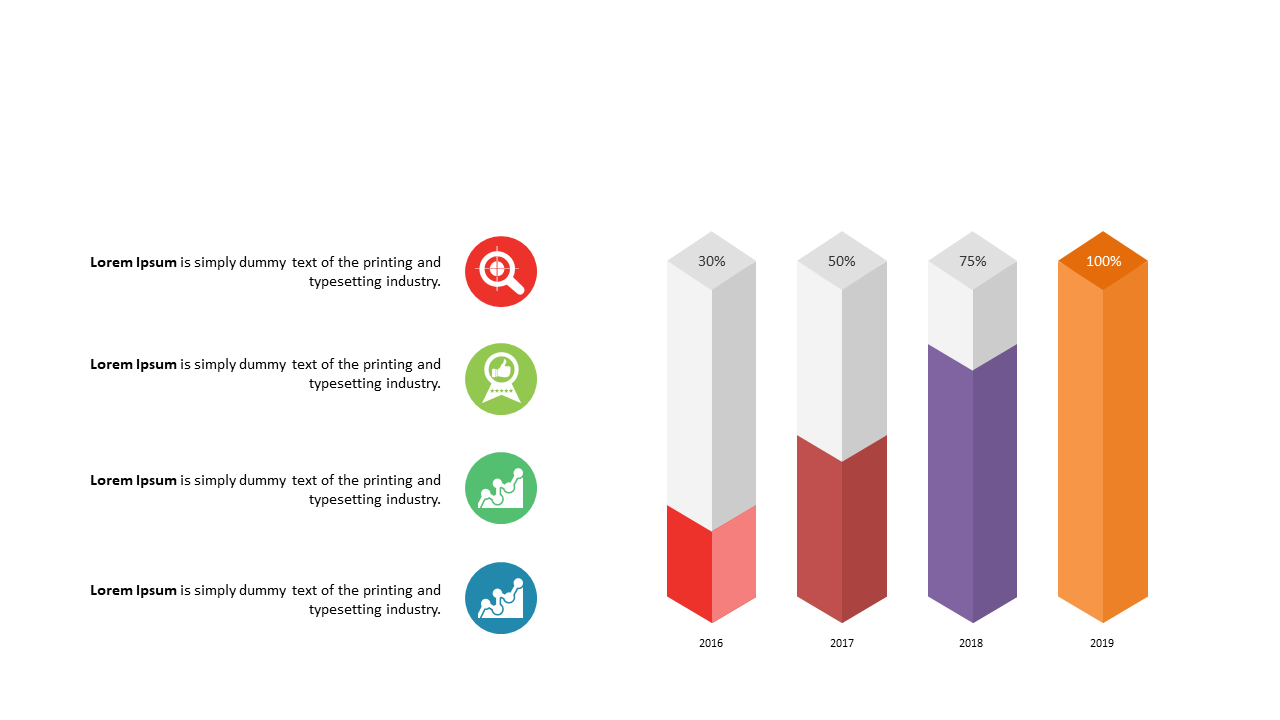
When presenting data, capturing your audience’s attention is crucial, yet often challenging. This slide features a striking 3D column chart paired with relevant icons, ensuring your quantitative insights leap off the screen and resonate with your audience.
You’ll convey complex information in a clear, memorable format that enhances understanding. Ideal for financial analysts, sales directors, and project leaders, this slide fits perfectly in budget reviews, performance metrics presentations, or project updates. It allows professionals to drive home key data points while keeping the atmosphere engaging, making it easier for your audience to follow along.
For just $0.99, you can quickly download this eye-catching slide, which is fully editable in both PowerPoint and Google Slides. It’s designed for ease of use, allowing you to polish your presentation in minutes.
$0.99 – Purchase Checkout
Added to cart







