Showcase Data Comparisons with 3D Bar Graphs
Product Description
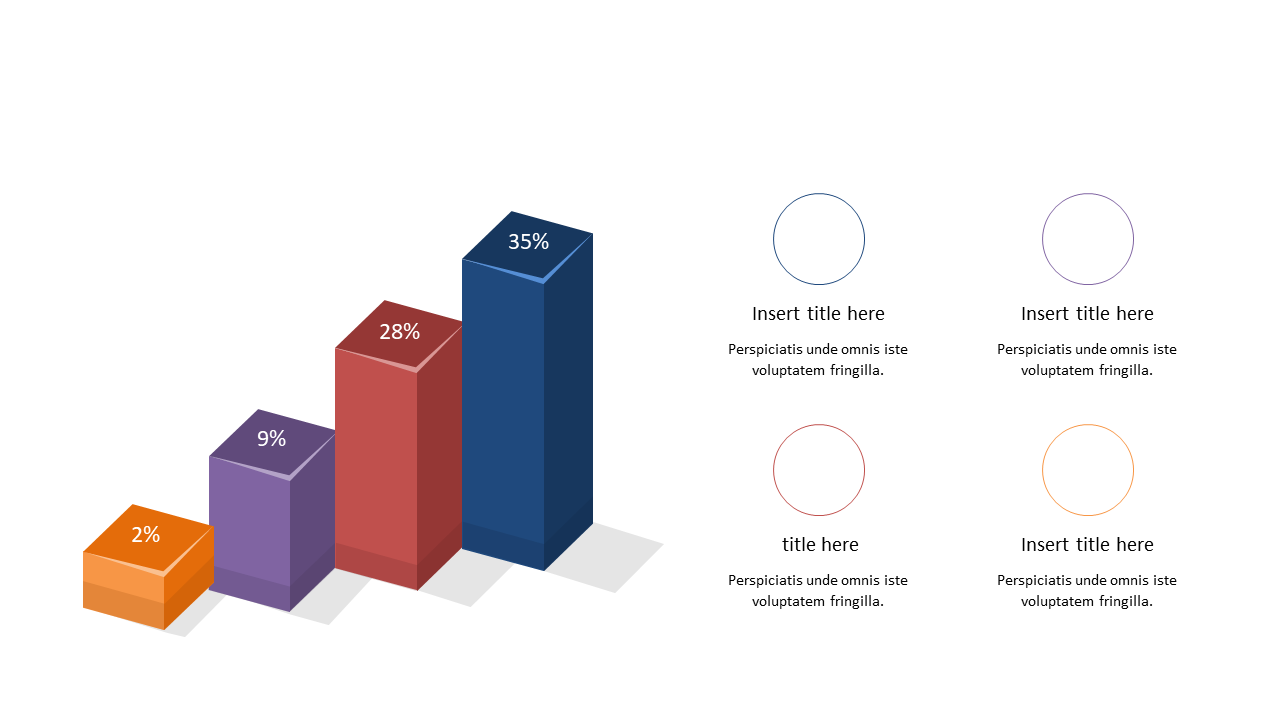
Trying to make data comparisons clear and compelling can be a challenge, especially when the numbers are dense and the stakes are high. This 3D bar graph slide transforms complex percentage values into a visually striking display that captures attention and conveys your message effectively.
It adds an extra layer of engagement with editable text boxes for your commentary. Business analysts, financial advisors, and project managers can all benefit from this slide during presentations or reports. Whether you’re presenting quarterly earnings to your team, comparing project performance metrics, or discussing market research results with clients, this slide makes your data stand out and makes it easier for your audience to understand.
At just $0.99, you’ll receive an instantly downloadable slide that’s fully editable in PowerPoint and Google Slides. Customize it to fit your needs in minutes and elevate your presentations effortlessly.
$0.99 – Purchase Checkout
Added to cart







