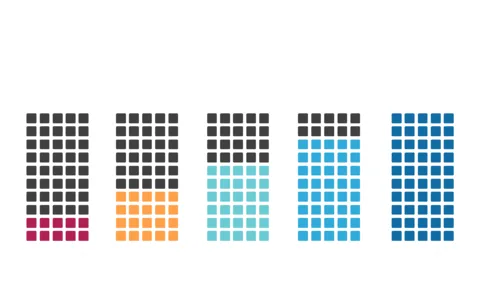
Stylish Bar Graph for Data Trends
Product Description
Translating complex data into a visually appealing format can often feel like a daunting task. As a business analyst, you want your audience to understand trends without getting lost in the details.
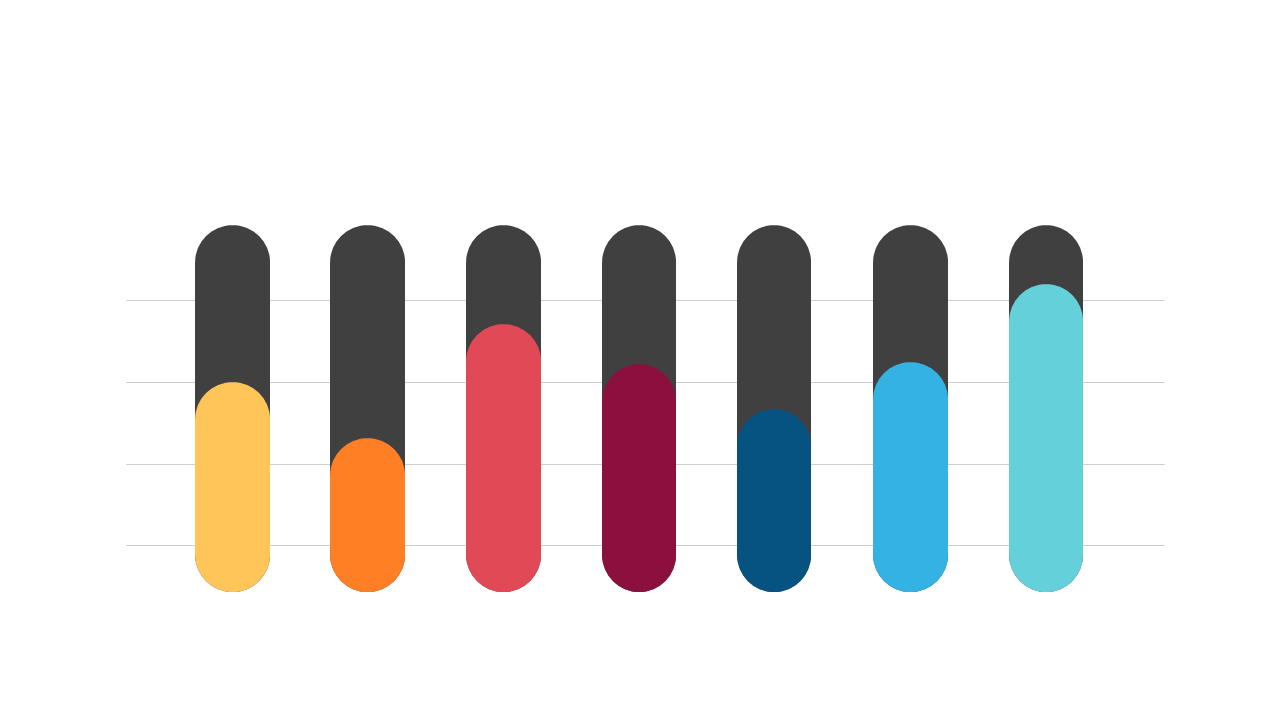
This stylish bar graph offers a contemporary design, making it easier to present comparative data in a way that captures attention and facilitates understanding. This slide is ideal for business analysts presenting performance trends, product managers comparing features, or any professional needing to showcase data trends clearly and effectively. The modern aesthetic ensures that your audience remains engaged, while the customization options allow for easy adaptations to fit your presentation theme.
Available for just $0.99, you can download this stylish bar graph slide instantly and edit it in PowerPoint or Google Slides. Transform your data storytelling in minutes and deliver a presentation that resonates with your audience.
$0.99 – Purchase Checkout
Added to cart