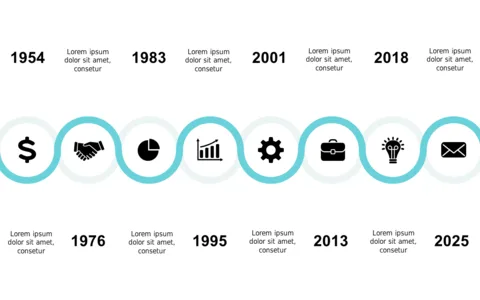
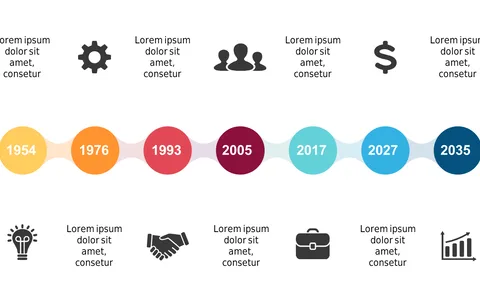
Visualize Progress with Circular Timeline Layout
Product Description
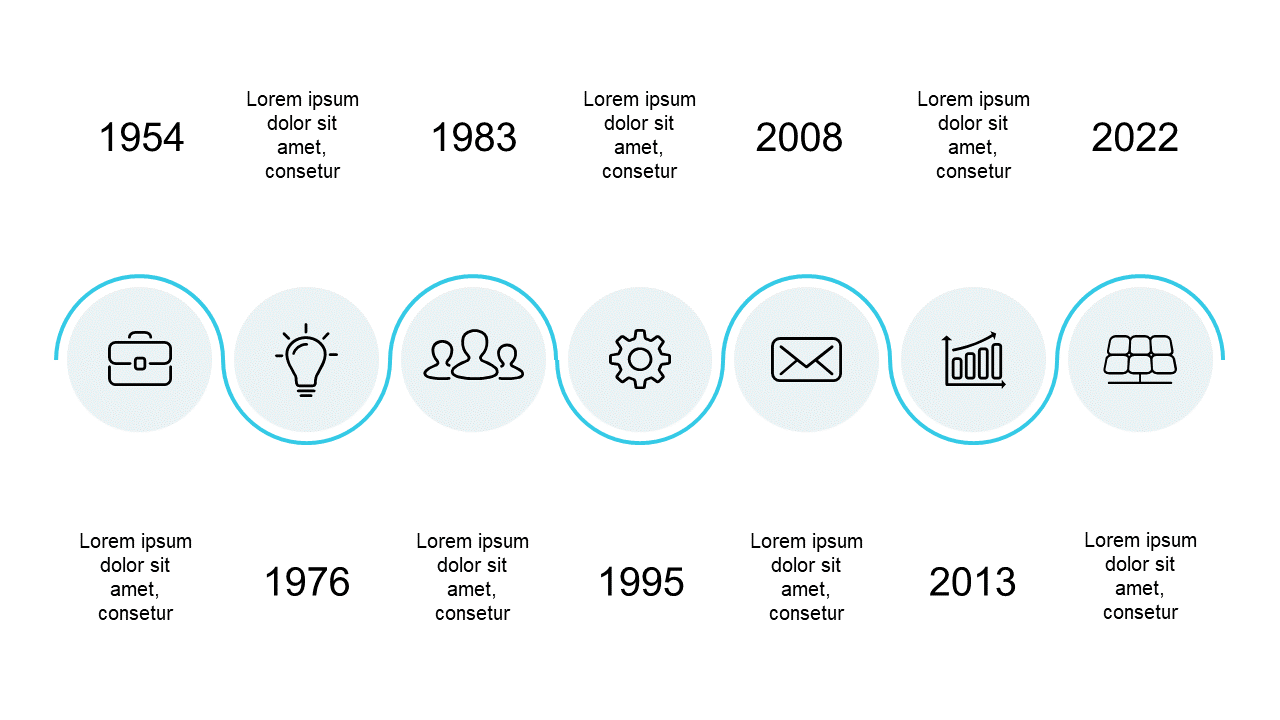
Finding a way to showcase your organization’s progress over time can often feel daunting. This circular timeline layout offers a visual representation of key milestones, making it easier for your audience to follow the historical narrative of your projects.
You’ll ensure that every important date and icon stands out. This slide works well for team leaders sharing project timelines, consultants presenting organizational achievements, or educators outlining curriculum progress. If you’re preparing for a strategic meeting, a client update, or a school presentation, this design will effectively communicate your timeline.
For only $0.99, you can download this slide right away and modify it in PowerPoint or Google Slides. With its user-friendly format, you can quickly edit icons and dates to fit your specific narrative, helping you finish your presentation effortlessly.
$0.99 – Purchase Checkout
Added to cart