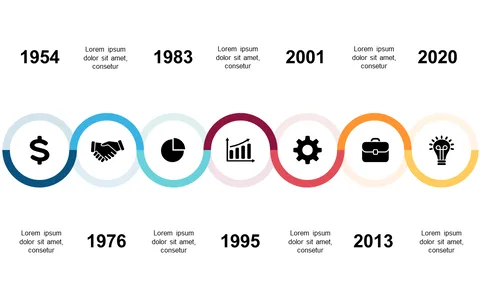
Present Project Milestones with Curved Timeline
Product Description
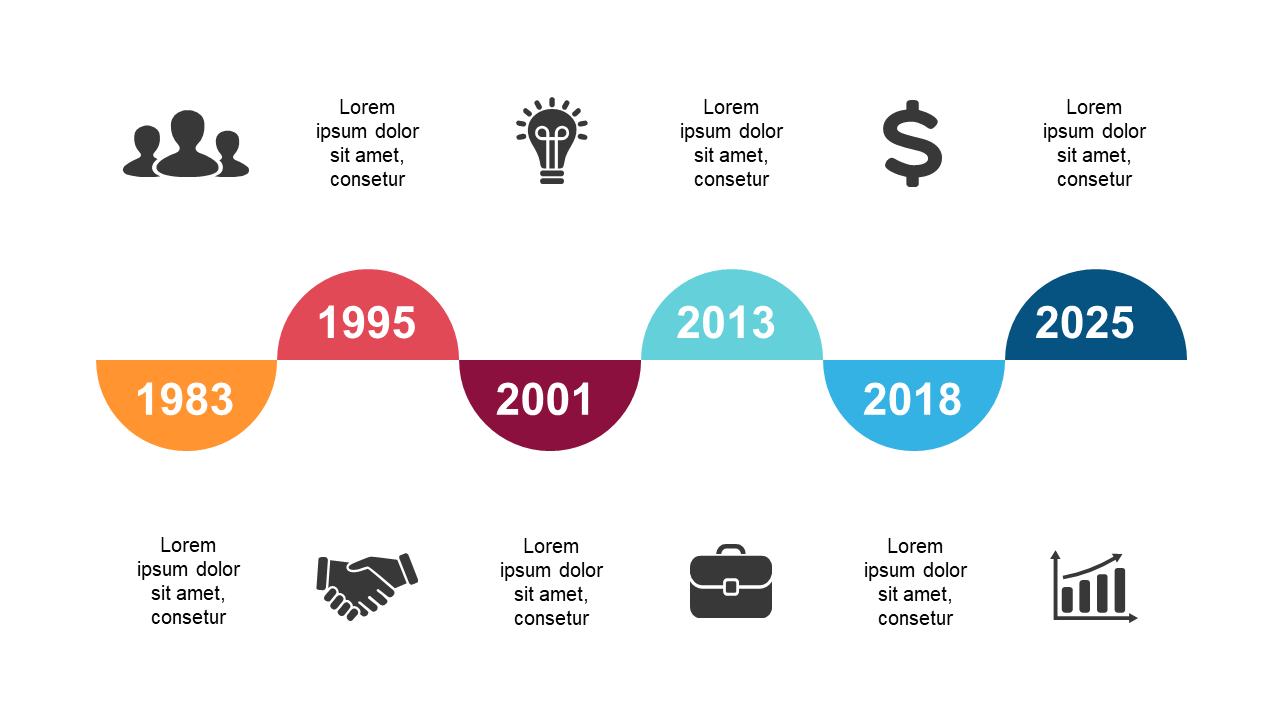
Presenting project milestones can often get confusing without a clear visual aid. This slide features a curved timeline layout that neatly organizes your key dates and milestones, helping your audience follow along with ease.
You’ll find that a straightforward design like this can make complex information more digestible. Project managers, team leaders, and event coordinators can use this slide for various presentations, whether in project updates, client meetings, or strategy sessions. It works well for highlighting important dates and keeping everyone informed about the project’s trajectory.
For just $0.99, you can download this slide immediately and tailor it in either PowerPoint or Google Slides. It’s easy to modify, ensuring you can incorporate your specific details quickly and efficiently.
$0.99 – Purchase Checkout
Added to cart