Present Important Dates with Curved Timeline
Product Description
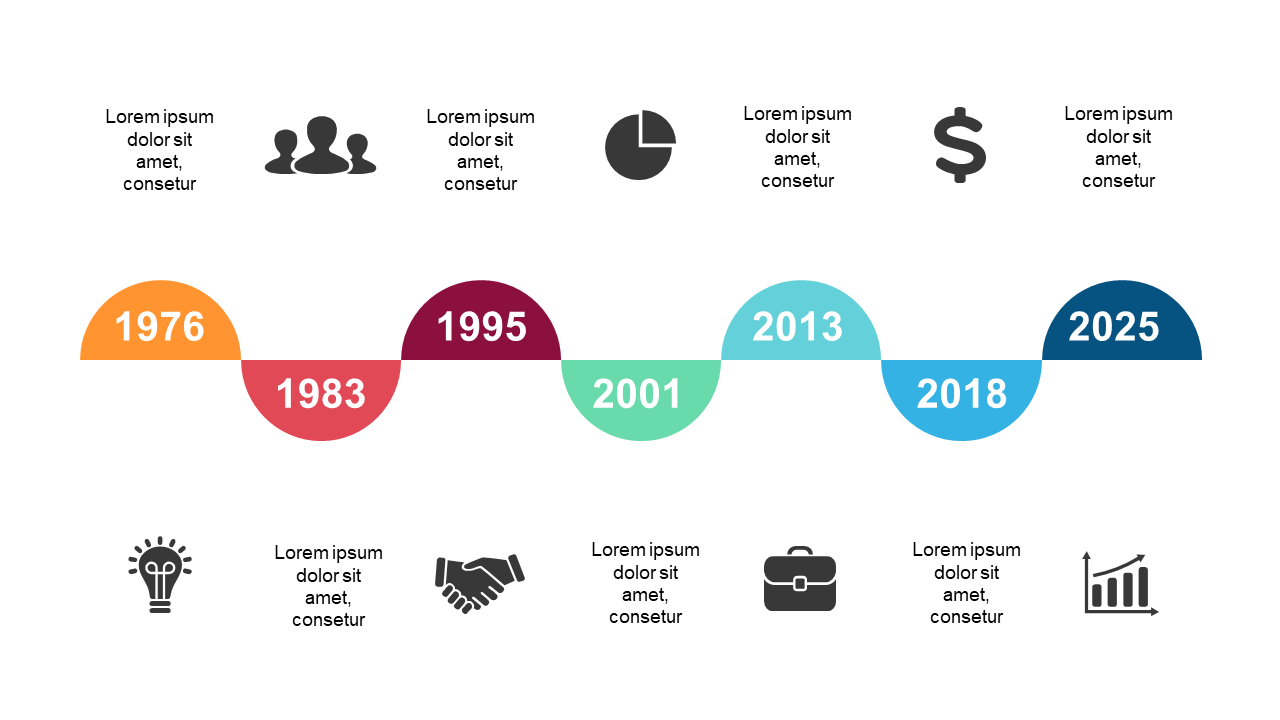
Presenting important dates can often feel overwhelming for both you and your audience, especially in complex projects. This curved timeline layout takes the guesswork out of your presentation by visually marking significant milestones, making your message clear and memorable.
You can effortlessly emphasize crucial developments. This slide is ideal for educators outlining course timelines, project managers tracking deliverables, or business analysts summarizing growth milestones. Whichever role you’re in, this timeline will help you communicate the sequence of events in a straightforward manner, ensuring your audience stays engaged.
For just $0.99, you can download this slide right away and customize it in PowerPoint or Google Slides. Changing colors and dates is easy, giving you a polished final product in just minutes.
$0.99 – Purchase Checkout
Added to cart