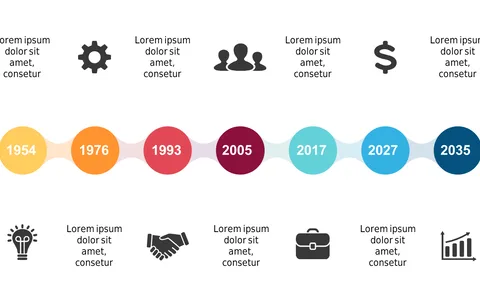
Milestone Timeline with Icons

Product Description
When it comes to showing progression over time, traditional lists can be tedious and ineffective. This sleek milestone timeline with colorful icons allows you to present key events in a visually appealing manner, capturing your audience’s attention while conveying essential information.
Project managers, marketers, and business developers will find this design particularly helpful during presentations focused on quarterly goals or project achievements. It’s a fantastic way to communicate your milestones and keep everyone aligned on progress.
For just $0.99, you can download this slide instantly and edit it with ease in PowerPoint or Google Slides. Customize it to fit your project’s theme and deliver a polished presentation in a matter of minutes.
$0.99 – Purchase Checkout
Added to cart