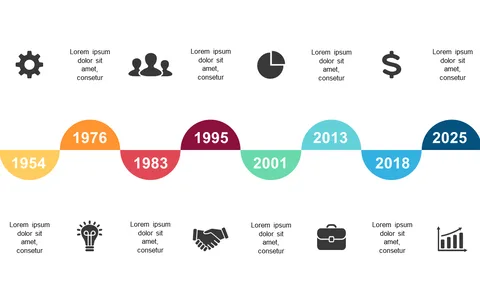
Colorful Timeline for Project Milestones

Product Description
Keeping track of multiple projects and their timelines can be overwhelming, especially when clarity is key. This colorful timeline slide offers a visually engaging way to present project milestones from 2020 to 2025, ensuring your audience can easily follow along.
Business professionals like project managers, event planners, and operations directors will find this slide invaluable during status meetings or project reviews. It helps simplify complex timelines while keeping your audience engaged and informed, making your presentation more effective.
Purchase this slide for only $0.99, and enjoy an instant download that’s fully editable in PowerPoint and Google Slides. You’ll have the ability to tailor it to your needs and impress your audience in no time.
$0.99 – Purchase Checkout
Added to cart