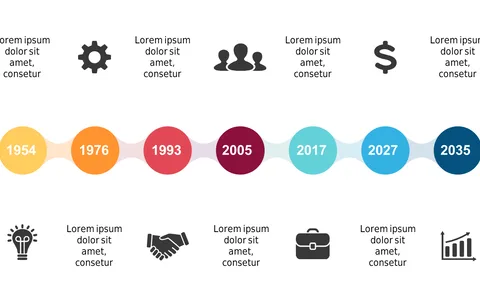
Present Significant Milestones with Triangular Timeline

Product Description
Coordinating project timelines can often feel overwhelming, especially when you need to make important milestones stand out. This triangular timeline slide catches the eye and clearly lays out your project’s key events next to their corresponding years, ensuring your audience grasps the critical path of your initiatives.
Think about project managers in tech firms needing to highlight product launch dates, or marketing professionals laying out a campaign’s phases. This slide is perfect for quarterly business reviews, team meetings, and client presentations where clarity about timing is crucial.
For just $0.99, you can download this slide instantly and edit it easily in PowerPoint or Google Slides. No hassle, just plug in your information and you’re good to go!
$0.99 – Purchase Checkout
Added to cart