Data Comparison with Gradient Stacked Bar Chart
Product Description
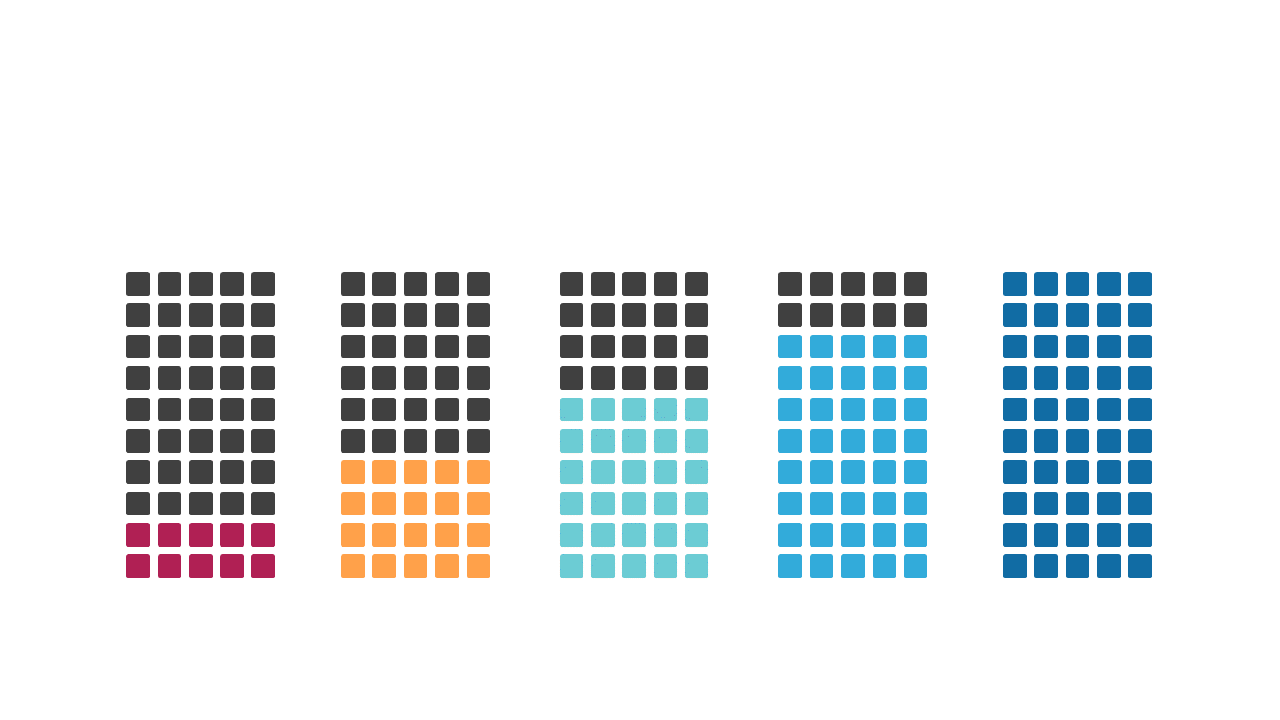
Making your data stand out can be a challenge, especially when you’re trying to tell a compelling story through numbers alone. The gradient stacked bar chart helps you highlight important trends and differences, ensuring your audience grasps the insights quickly. Gone are the days of boring spreadsheets; this visual tool brings your data to life.
Imagine a finance manager needing to compare revenue streams or a sales director presenting performance metrics to their team. This slide is perfect for quarterly business reviews, sales meetings, or marketing performance presentations where clear visuals can drive home your points.
It’s tailored for professionals in roles that rely on impactful data storytelling. For only $0.99, this slide is available for instant download and ready for editing. Use it in PowerPoint or Google Slides, and customize it to fit your needs in just a few clicks.
$0.99 – Purchase Checkout
Added to cart







