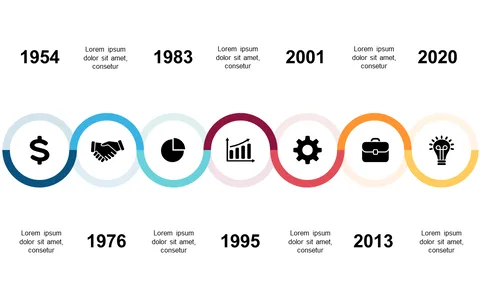
Present Project Phases with Circular Space Timeline

Product Description
Explaining project phases can often lead to confusion, especially when you’re juggling multiple tasks. This circular timeline design simplifies that complexity, visually guiding your audience through each phase with colorful icon-based markers that grab attention.
Project managers, team leads, and consultants will find this slide particularly useful during status updates or project kickoff meetings. It’s ideal for breaking down timelines in industries like tech, construction, or event planning, where clear communication of phases is essential to success.
For just $0.99, you can easily download and customize this slide in both PowerPoint and Google Slides. The vibrant design is ready for you in minutes, making it simple to create a standout presentation that keeps everyone aligned.
$0.99 – Purchase Checkout
Added to cart